Data with Bert logo

Visualizing Hash Match Join Internals And Understanding Their Implications

This post is part 3 in a series about physical join operators (be sure to check out part 1 - nested loops joins, and part 2 - merge joins).

Watch this week's video on YouTube

Hash Match joins are the dependable workhorses of physical join operators.

While Nested Loops joins will fail if the data is too large to fit into memory, and Merge Joins require that the input data are sorted, a Hash Match will join any two data inputs you throw at it (as long as the join has an equality predicate and you have enough space in tempdb). 

The base hash match algorithm has two phases that work like this:
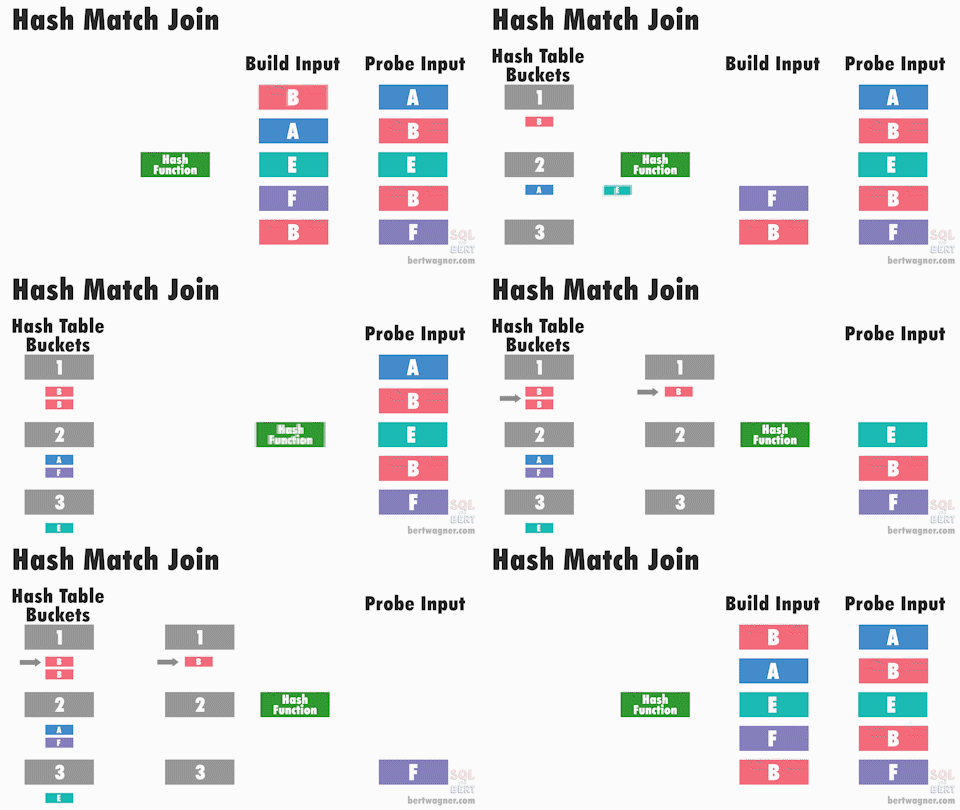
Hash-Match-Join-Looping-1

During the first "Build" phase, SQL Server builds an in-memory hash table from one of the inputs (typically the smaller of the two).  The hashes are calculated based on the join keys of the input data and then stored along with the row in the hash table under that hash bucket.  Most of the time there is only 1 row of data per hash bucket except when:

  1. There are rows with duplicate join keys.
  2. The hashing function produces a collision and totally different join keys receive the same hash (uncommon but possible).

Once the hash table is built, SQL Server begins the "Probe" phase.  During this second phase, SQL Server calculates the join key hash for each row in the second input, and checks to see if it exists in the hash table created in the first build phase.  If it finds a match for that hash, it then verifies if the join keys between the row(s) in the hash table and the row from the second table actually match (it needs to perform this verification due to potential hash collisions).

A common variation on this hash match algorithm occurs when the build phase cannot create a hash table that can be fully stored in memory:

Hash-Match-Join-spill-looping-1

This happens when the data is larger than what can be stored in memory or when SQL Server grants an inadequate amount of memory required for the hash match join.

When SQL Server runs doesn't have enough memory to store the build phase hash table, it proceeds by keeping some of the buckets in memory, while spilling the other buckets to tempdb. 

During the probe phase, SQL Server joins the rows of data from the second input to buckets from the build phase that are in memory. If the bucket that the row potentially matches isn't currently in memory, SQL Server writes that row to tempdb for later comparison. 

Once the matches for one bucket are complete, SQL Server clears that data from memory and loads the next bucket(s) into memory. It then compares the second input's rows (currently residing in tempdb) with the new in-memory buckets.

As with every physical join operator in this series, there are way more details about the hash match operator on Hugo Kornelis's reference on hash matches.

What Do Hash Match Joins Reveal?

Knowing the internals of how a hash match join works allows us to infer what the optimizer thinks about our data and the join's upstream operators, helping us focus our performance tuning efforts. 

Here are a few scenarios to consider the next time you see a hash match join being used in your execution plan:

  • While hash match joins are able to join huge sets of data, building the hash table from the first input is a blocking operation that will prevent downstream operators from executing. Due to this, I always check to see if there is an easy way to convert a hash match to either a nested loops or merge join.  Sometimes that won't be possible (too many rows for nested loops or unsorted data for merge joins) but it's always worth checking if a simple index change or improved estimates from a statistics update would cause SQL Server to pick a non-blocking hash match join operator.

  • Hash match joins are great for large joins - since they can spill to tempdb, it allows them to perform joins on large datasets that would fail an in-memory join with either the nested loops or merge join operators.

    • Seeing a hash match join operator means SQL Server thinks the upstream inputs are big.  If we know our inputs shouldn't be that big, then it's worth checking if we have a stats/estimation problem that is causing SQL Server to choose a hash match join incorrectly.
  • When executed in memory, hash match joins are fairly efficient. Problems arise when the build phase spills to tempdb.

    • If I notice the little yellow triangle indicating that the join is spilling to tempdb, I take a look to see why: if the data is larger than the server's available memory, there's not much that can be done there, but if the memory grant seems unusually small that means we probably have another statistics problem that is providing the SQL Server optimizer estimates that are too low.

Visualizing Merge Join Internals And Understanding Their Implications

This post is part 2 in a series about physical join operators (be sure to check out part 1 - nested loops joins, and part 3 - hash match joins).

Watch this week's video on YouTube

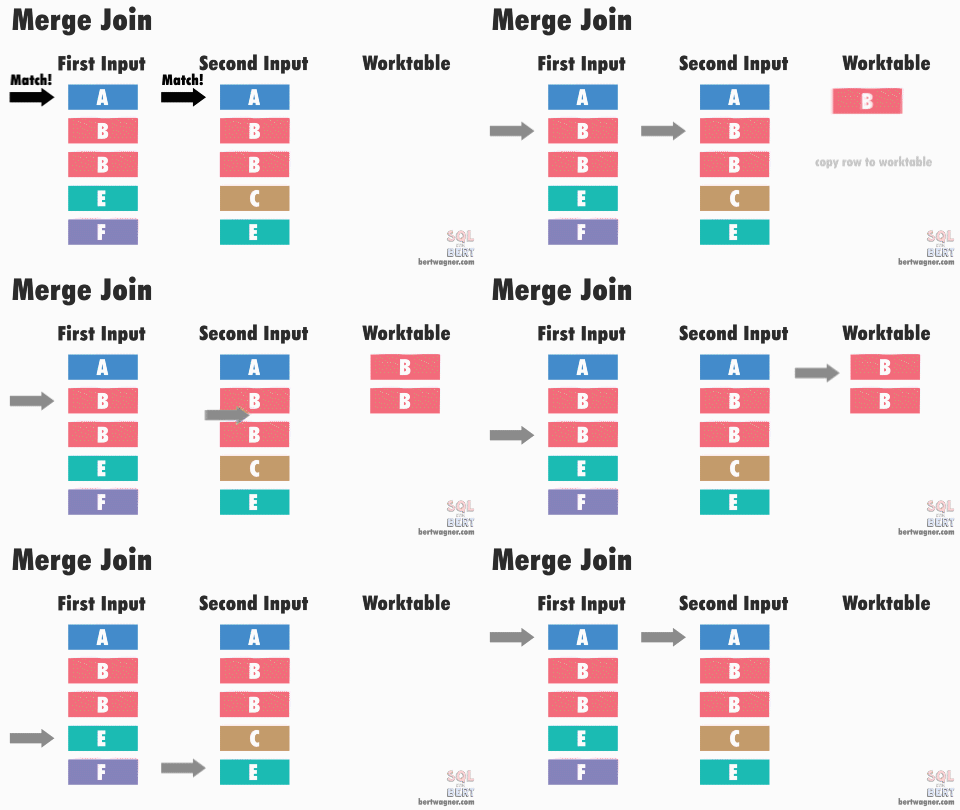
Merge joins are theoretically the fastest* physical join operators available, however they require that data from both inputs is sorted:

Merge-Join-1

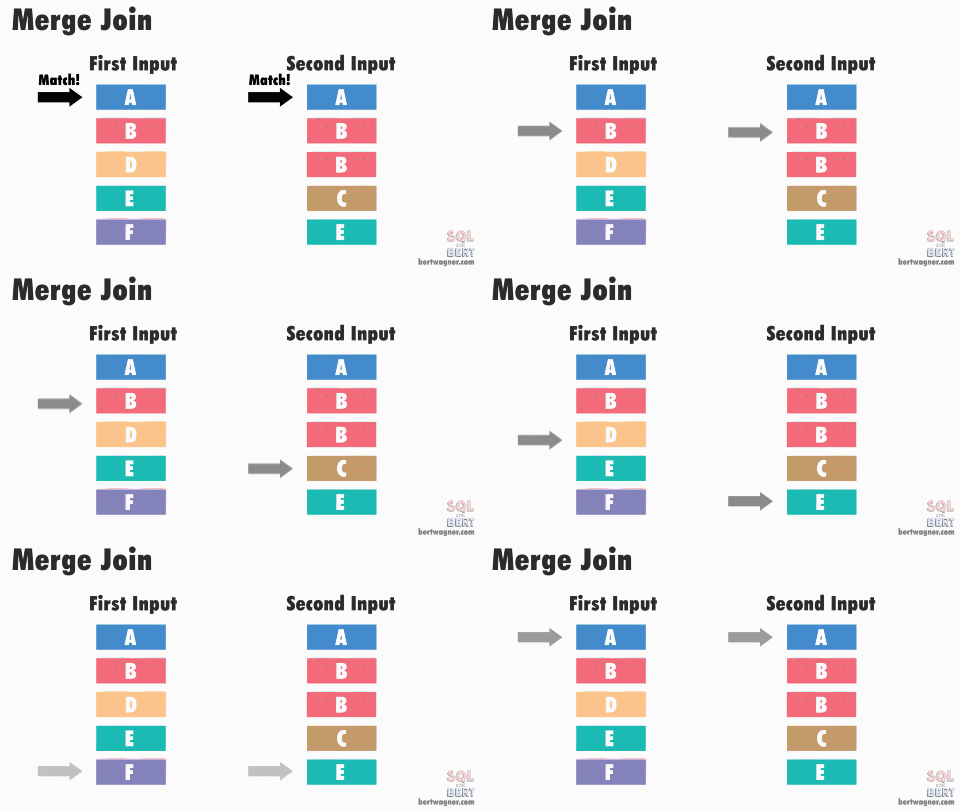
The base algorithm works as follows: SQL Server compares the first rows from both sorted inputs.  It then continues comparing the next rows from the second input as long as the values match the first input's value.

Once the values no longer match, SQL Server increments the row of whichever input has the smaller value - it then continues performing comparisons and outputting any joined records. (For more detailed information, be sure to check out Craig Freedman's post on merge joins.)

This is efficient because in most instances SQL Server never has to go back and read any rows multiple times.  The exception here happens when duplicate values exist in both input tables (or rather, SQL Server doesn't have meta data available proving that duplicates don't exist in both tables) and SQL Server has to perform a many-to-many merge join:

Merge-Join-many-to-many

Note: The image above and the explanation below are "good enough" for understanding this process for practical purposes - if you want to dive into the peek-ahead buffers, optimizations, and other inner workings of this process, I highly recommend reading through Hugo Kornelis's reference on merge joins.

A many-to-many join forces SQL Server to write any duplicated values in the second table into a worktable in tempdb and do the comparisons there.  If those duplicated values are also duplicated in the first table, SQL Server then compares the first table's values to those already stored in the worktable.

What Do Merge Joins Reveal?

Knowing the internals of how a merge join works allows us to infer what the optimizer thinks about our data and the join's upstream operators, helping us focus our performance tuning efforts. 

Here are a few scenarios to consider the next time you see a merge join being used in your execution plan:

  • The optimizer chooses to use a merge join when the input data is already sorted or SQL Server can sort the data for a low enough cost.  Additionally, the optimizer is fairly pessimistic at calculating the costs of merge joins (great explanation by Joe Obbish), so if a merge join makes its way into your plans, it probably means that it is fairly efficient.

  • While a merge join may be efficient, it's always worth looking at why the data coming in to the merge join operator is already sorted:

    • If it's sorted because the merge join is pulling data directly from an index sorted on your join keys, then there is not much to be concerned about.
    • If the optimizer added a sort to the upstream merge join though, it may be worth investigating whether it's possible to presort that data so SQL Server doesn't need to sort it on its own.  Often times this can be as simple as redefining an included index column to a key column - if you are adding it as the last key column in the index then regression impact is usually minor but you may be able to allow SQL Server to use the merge join without any additional sorting required.
  • If your inputs contain many duplicates, it may be worth checking if a merge join is really the most efficient operator for the join.  As outlined above, many-to-many merge joins require tempdb usage which could become a bottle neck!

So while merge joins are typically not the high-cost problem spots in your execution plans, it's always worth investigating upstream operators to see if some additional improvements can be made.

[]{#fastest-exception}

*NOTE: There are always exceptions to the rule.  Merge joins have the fastest algorithm since each row only needs to be read once from the source inputs.  Also, optimizations occurring in other join operators can give those operators better performance under certain conditions.

For example, a single row outer table with an indexed inner table using a nested loops join will outperform the same setup with a merge join because of the inner loops joins' optimizations:

DROP TABLE IF EXISTS T1;
GO
CREATE TABLE T1 (Id int identity PRIMARY KEY, Col1 CHAR(1000));
GO

INSERT INTO T1 VALUES('');
GO

DROP TABLE IF EXISTS T2;
GO
CREATE TABLE T2 (Id int identity PRIMARY KEY, Col1 CHAR(1000));
GO

INSERT INTO T2 VALUES('');
GO 100

-- Turn on execution plans and check actual rows for T2
SELECT *
FROM T1 INNER LOOP JOIN T2 ON T1.Id = T2.Id;

SELECT *
FROM T1 INNER MERGE JOIN T2 ON T1.Id = T2.Id;

*There might also be instances where inputs with many duplicate records that require worktables may be slower than a nested loop join. *

As I mentioned though, I typically find these types of scenarios to be the exceptions when encountering merge joins in the real-world.

Visualizing Nested Loops Joins And Understanding Their Implications

This post is the first in a series about physical join operators (be sure to check out part 2 - merge joins, and part 3 - hash match joins).

Watch this week's video on YouTube

What Physical Join Operators Tell Us

Everyone has their own method of reading an execution plan when performance tuning a slow SQL query.  One of the first things I like to look at are what kind of join operators are being used:

image-1

These three little icons may not seem like the most obvious place to begin troubleshooting a slow query, but with larger plans especially I like starting with a quick glance at the join operators because they allow you to infer a lot about what SQL Server thinks about your data.

This will be a three part series where we'll learn how each join algorithm works and what they can reveal about our upstream execution plan operators.

Nested Loops Join

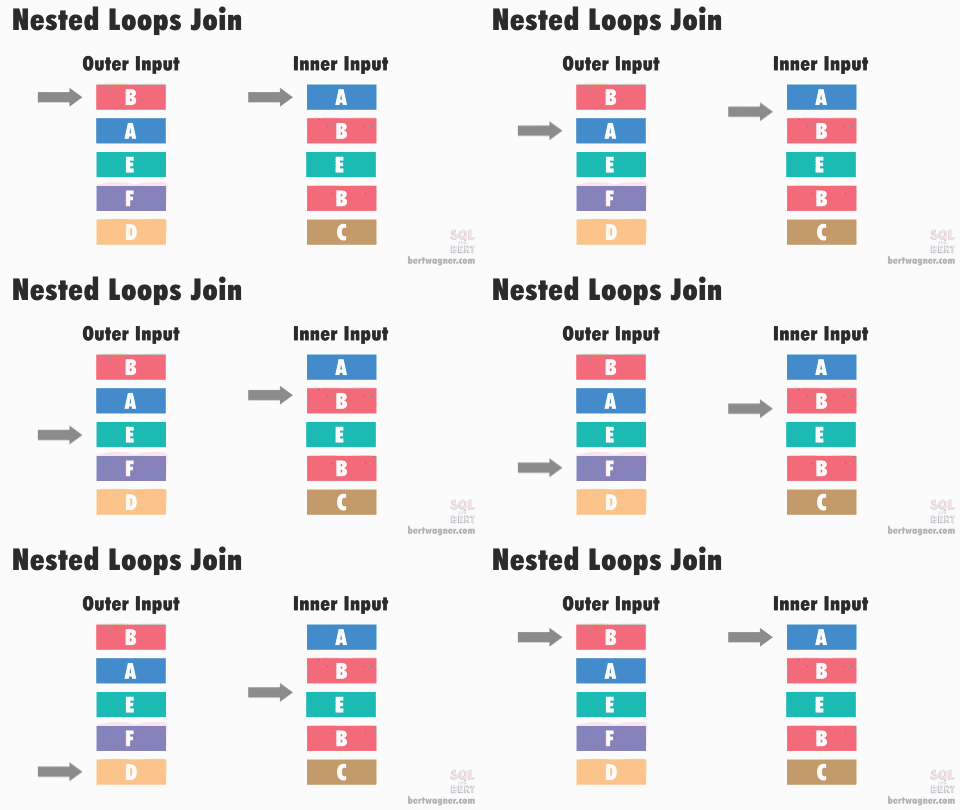
Nested-Loop-Join-50fps-1

Nested loops joins work like this: SQL Server takes the first value from our first table (our "outer" table - by default SQL Server decides for us which table of the two this will be), and compares it to every value in our second "inner" table to see if they match. 

Once every inner value has been checked, SQL Server moves to the next value in the outer table and the process repeats until every value from our outer table has been compared to every value in our inner table.

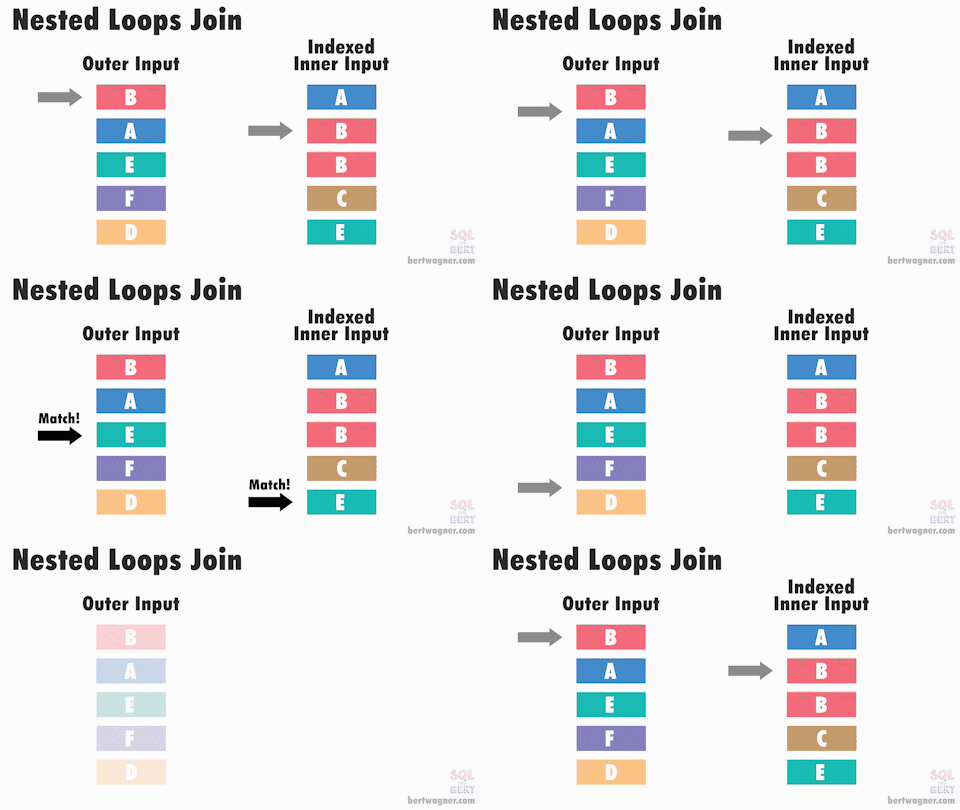
This description is a worst case example of the performance of a nested loop join.  Several optimizations exist that can make the join more efficient.  For example, if the inner table join values are sorted (because of an index you created or a spool that SQL Server created), SQL Server can process the rows much faster:

nest-loops-sorted-50fps-2

In the above animation, the inner input is a index sorted on the join key, allowing SQL Server to seek directly to the rows it needs, reducing the total number of comparisons that need to be made

For more in-depth explanations of the internals and optimizations of nested loops joins, I recommend reading this post by Craig Freedman as well as Hugo Kornelis's reference on nested loops.

What Do Nested Loops Joins Reveal?

Knowing the internals of how a nested loops join works allows us to infer what the optimizer thinks about our data and the join's upstream operators, helping us focus our performance tuning efforts. 

Here are a few scenarios to consider the next time you see a nested loops join being used in your execution plan:

  • Nested loops joins are CPU intensive; at worst, every row needs to be compared to every other row and this can take some time.  This means when you see a nested loops join, SQL Server probably thinks that one of the two inputs is relatively small.
  • ... and if one of the inputs is relatively small, great!  If instead you see upstream operators that are moving large amounts of data, you may have a estimation problem going on in this area of the plan and may need to update stats/add indexes/refactor the query to have SQL Server provide better estimates (and maybe a more appropriate join).

  • Nested loops sometimes accompany RID or key lookups.  I always check for one of these because they often leave room for some performance improvements:

    • If a RID lookup exists, it's usually easy enough to add a clustered index to that underlying table to squeeze out some extra performance.
  • If either RID or key lookup exist, I always check what columns are being returned to see if a smaller index could be used instead (by including a column in a key/column of an existing index) or if the query can be refactored to not bring back those columns (eg. get rid of the SELECT *).

  • Nested loops joins do not require data to be sorted on input.  However, performance can improve with an indexed inner data source (see animation above), and SQL Server might choose a more efficient operator if the inputs are both sorted. 

    • At the very least, nested loops joins make me think to check whether the input data isn't sorted because of some upstream transformations, or because of missing indexes.

So while nested loops in your plans will always require more investigation, looking at them and the operators around them can provide some good insight into what SQL Server thinks about your data.

Join Elimination: When SQL Server Removes Unnecessary Tables

In this post and video at SQLPerformance.com, I discuss what join elimination is and how it works in SQL Server.  Join elimination is one of the many techniques that the SQL Server query optimizer uses to create efficient query plans. Specifically, join elimination occurs when SQL Server can establish equality by using query logic or trusted database constraints to eliminate unnecessary joins... Read more or watch the video

The Forgotten Fourth SQL Server Recovery Model

Watch this week's video on YouTube

SQL Server recovery models define when database transactions are written to the transaction log.   Understanding these models is critical for backup and recovery purposes as well as for how their behaviors impact the performance of queries.

Today we'll examine the differences between SQL Server's three official recovery models as well as an unofficial "fourth" recovery model that won't help in backup/recovery, but will help in performance of certain processes.

Full Recovery

The only recovery model that can potentially save all of your data when something bad happens (NOTE: "potentially" because if you aren't taking enough and/or testing your backups, you might experience data loss).

Under the full recovery model, every transaction is written to the transaction log first, and then persisted to the actual database.  This means if something disastrous happens to your server, as long as the change made its way into the transaction log AND your transaction log is readable AND your previous full/differential/log backups can be restored, you shouldn't experience any data loss (there are a lot of assumptions made with that statement though, so don't use this post as your only data loss prevention guide)

From a performance standpoint, full recovery is the slowest of the bunch because every transaction needs to be logged, and that creates some overhead.   Might be good for your OLTP databases, maybe not so much for your analytical staging databases (assuming you can recreate that data).

Simple Recovery

While some people incorrectly believe that simple recovery means no writing to the transaction log  (need proof that a database in simple recovery still writes to the trans log?  Try running ROLLBACK TRANSACTION after a huge delete) it actually means that the transaction log is cleared as soon as SQL Server is done using it and data has made its way to disk.

Since the transaction log is cleared regularly, your overall log size can be smaller since space is regularly reused.  Additionally, since that space is cleared you don't have to worry about backing it up.

No persistence of the transaction log means you won't be able to recover all of your data in case of server failure though.  This is generally OK if you are using simple recovery in databases where its easy to recreate any data since your last full backup (eg. staging data where you can easily redo the transactions that were lost).

Simple recovery minimally logs as many transactions as possible, making the throughput faster.  This works well in staging databases and for ETLs where data is in flux and can be easily recreated.

Bulk-Logged Recovery

If Goldilocks thinks the full recovery model has too much logging, and the simple model not enough logging, then she'll find the amount of logging in the bulk-logged recovery model to be just right.

Under bulk-logged, most transactions are fully logged, allowing for data restoration of those fully logged transactions if the need arises.  Bulk transactions however are minimally logged, allowing for better performance of things like bulk inserts (but no ability for restoration).

While restorations under the bulk-logged recovery model aren't as flexible as full recovery (eg. if the transaction log has any bulk transactions, you have to restore the whole transaction log instead of just up to a certain point), it does allow full logging for when most people need it and minimal logging for when most people don't need it.  Meaning for certain situations you can have your cake and eat it too!

The Fourth Unofficial Recovery Model: In-Memory SCHEMA_ONLY Durability

The SCHEMA_ONLY durability setting on a memory optimized table isn't a recovery model.  But it does behave a little bit like a recovery model in the sense that it defines how operations against your memory optimized table interact with your transaction log:

They don't.  Well, almost.

And that's the beauty of it, at least from a performance stand point.  If you are willing to trade off the ability to recover data for performance, then the SCHEMA_ONLY durability fits the bill - so long transaction log overhead.

So while none of the official recovery models allow you to prevent writing to the transaction log, the SCHEMA_ONLY durability setting does!