Watch this week's video on YouTube
In a traditional gaps and islands problem, the goal is to identify groups of continuous data sequences (islands) and groups of data where the sequence is missing (gaps).
While many people encounter gaps and islands problems when dealing with ranges of dates, and recently I did too but with an interesting twist:
How do you determine gaps and islands of data that has overlapping date ranges?
Overlapping Date Ranges
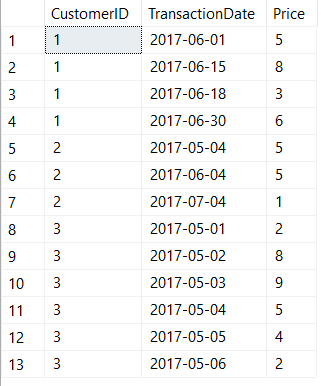
First let's start with some sample data to help follow along. The peculiarity to pay attention to is that the date ranges for each row might be completely discrete, completely enclosed, or they may overlap each other on either end:
DROP TABLE IF EXISTS #OverlappingDateRanges;
CREATE TABLE #OverlappingDateRanges (StartDate date, EndDate date);

INSERT INTO #OverlappingDateRanges
SELECT '8/24/2017', '9/23/2017'  UNION ALL
SELECT '8/24/2017', '9/20/2017'  UNION ALL
SELECT '9/23/2017', '9/27/2017'  UNION ALL
SELECT '9/25/2017', '10/10/2017' UNION ALL
SELECT '10/17/2017','10/18/2017' UNION ALL
SELECT '10/25/2017','11/3/2017'  UNION ALL
SELECT '11/3/2017', '11/15/2017'

SELECT * FROM #OverlappingDateRanges;
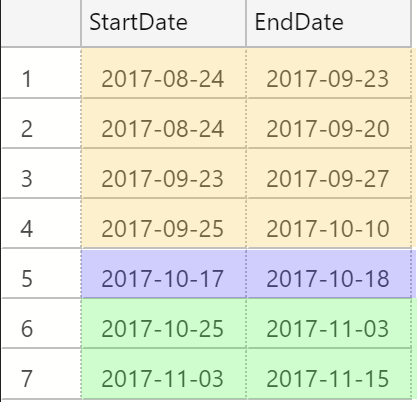
What's unusual about this data is that while the end date of some rows matches the start date of other rows (eg. row 6 and 7), the date ranges of some rows other rows are either fully contained within other rows (eg. row 2 is contained in row 1) while other rows only overlap one boundary (eg. row 4's EndDate doesn't overlap with any other rows, but its StartDate is before row 3's EndDate).
Solution
While there are several ways gaps and islands problems can be solved, here is the solution using window functions that made the most sense to me.
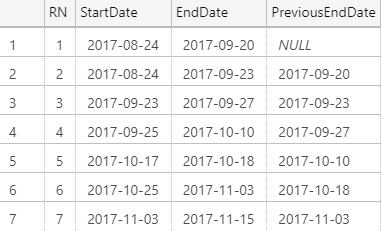
First, we need to create a row number column based on the sequence of start and end dates, as well as bring the previous row's EndDate to the current row:
SELECT
    ROW_NUMBER() OVER(ORDER BY StartDate,EndDate) AS RN,
    StartDate,
    EndDate,
    LAG(EndDate,1) OVER (ORDER BY StartDate, EndDate) AS PreviousEndDate
FROM
    #OverlappingDateRanges
Next we add two more fields:
- IslandStartInd: indicates when a new island begins by looking if the current row's StartDate occurs after the previous row's EndDate. We don't really need this column for the example, but I find it helpful to see what's going on in the next column.
- IslandId: indicates which island number the current row belongs to.
SELECT
    *,
    CASE WHEN Groups.PreviousEndDate >= StartDate THEN 0 ELSE 1 END AS IslandStartInd,
    SUM(CASE WHEN Groups.PreviousEndDate >= StartDate THEN 0 ELSE 1 END) OVER (ORDER BY Groups.RN) AS IslandId
FROM
(
    SELECT
        ROW_NUMBER() OVER(ORDER BY StartDate,EndDate) AS RN,
        StartDate,
        EndDate,
        LAG(EndDate,1) OVER (ORDER BY StartDate, EndDate) AS PreviousEndDate
    FROM
        #OverlappingDateRanges
) Groups
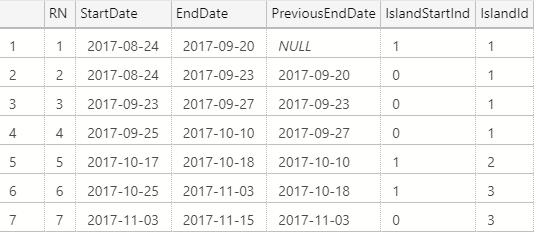
The IslandId field is just a SUM() of the IslandStartInd, similar to a window function running total.
Our final step is to aggregate our rows using an old fashioned GROUP BY to return the minimum and maximum start and end dates respectively from each of our islands:
SELECT
    MIN(StartDate) AS IslandStartDate,
    MAX(EndDate) AS IslandEndDate
FROM
    (
    SELECT
        *,
        CASE WHEN Groups.PreviousEndDate >= StartDate THEN 0 ELSE 1 END AS IslandStartInd,
        SUM(CASE WHEN Groups.PreviousEndDate >= StartDate THEN 0 ELSE 1 END) OVER (ORDER BY Groups.RN) AS IslandId
    FROM
    (
        SELECT
            ROW_NUMBER() OVER(ORDER BY StartDate,EndDate) AS RN,
            StartDate,
            EndDate,
            LAG(EndDate,1) OVER (ORDER BY StartDate, EndDate) AS PreviousEndDate
        FROM
            #OverlappingDateRanges
    ) Groups
) Islands
GROUP BY
    IslandId
ORDER BY
    IslandStartDate
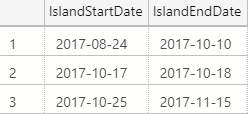
Voilà
Regardless of how messy the date ranges within an island are, this technique neatly identifies gaps in the data and returns the start and end of each island's date range. I often find myself using this technique in scenarios where I need to aggregate some date-based transactional data that otherwise would be too difficult to summarize with aggregate functions alone.