Data with Bert logo

Moving 1/3 of a heap

Watch this week's video on YouTube

A Giant Heap

Recently I had to filter out 1.2 billion records from a 3.5 billion row heap. Don't ask me why this 3.5 billion row table is stored as a heap.

If the lack of a clustered index wasn't bad enough, I also had some other restrictions:

  • I couldn't add a clustered index (or any index for that matter) sorted on the key I needed to filter on. It wasn't my system, and I needed to access the 1.2 billion records sooner than it would take to get a clustered index approved and added. Even then, maybe the lack of a clustered index on this table is a feature and my request would be denied. Who knows.
  • I didn't have a server that could store all of the data. At first I thought of copying all 3.5 billion rows to my own server and indexing it how I needed, but I didn't have enough storage space anywhere to do that.
  • My connection to the server had a relatively short timeout set on it. This also couldn't be changed. If I couldn't copy all 3.5 billion rows because of storage, I also couldn't copy all 1.2 billion records in one fell swoop because the connection would timeout.

Iterative Process

Scanning the table hundreds of times...

I struggled with this problem for a little bit. My deadline clock was ticking and I was stuck as to how I could copy and subsequently query the 1.2 billion rows of data I needed. My focus transitioned from "what is the best way to do this" to "how do I do this".

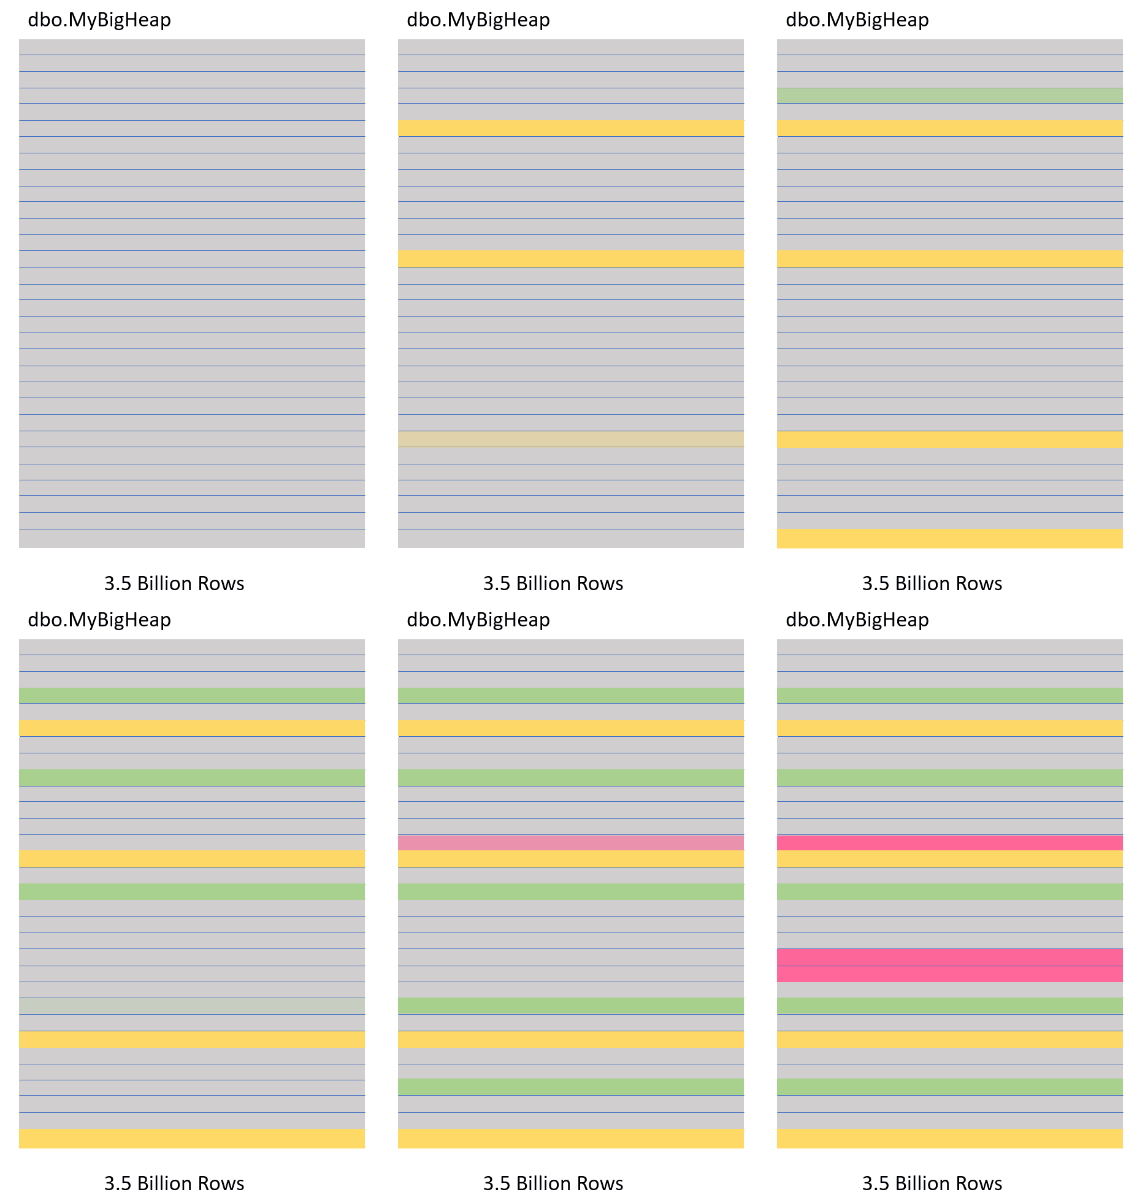
The solution that ended up working for me was to query the table hundreds of times, each time filtering out and copying only 1 week of data by running a query similar to this:

SELECT *
FROM dbo.MyBigHeap
WHERE
    CreateDate >= @StartDate
    AND CreateDate < @StopDate

Yes, this did cause me to scan the entire table hundreds of times, but in the end it was the right amount of data that I could copy at a time before the connection timed out.

Eventually I had the 1.2 billion rows I needed copied to my own server. I had a clustered column store index on the table (primarily for the compression savings) and some nonclustered indexes to support the queries I would need to run on it. Was this the best solution? I don't know. But it worked for me given the constraints and deadline I had to meet.

Moral of the Story

Always put a clustered index on your tables. Even if you don't have a use case to sort/filter them immediately, you will be creating a world of pain when someone comes along who does need to query that data.

SQL Server 2019 Feature Power Rankings

Watch this week's video on YouTube

With the release of SQL Server 2019 imminent, I thought it'd be fun to rank which features I am most looking forward to in the new release.

(Also, I needed a lighter blogging week since I'm busy finishing preparing for my two sessions at PASS Summit next week - hope to see you there!).

feature-rankings-quadrant-small

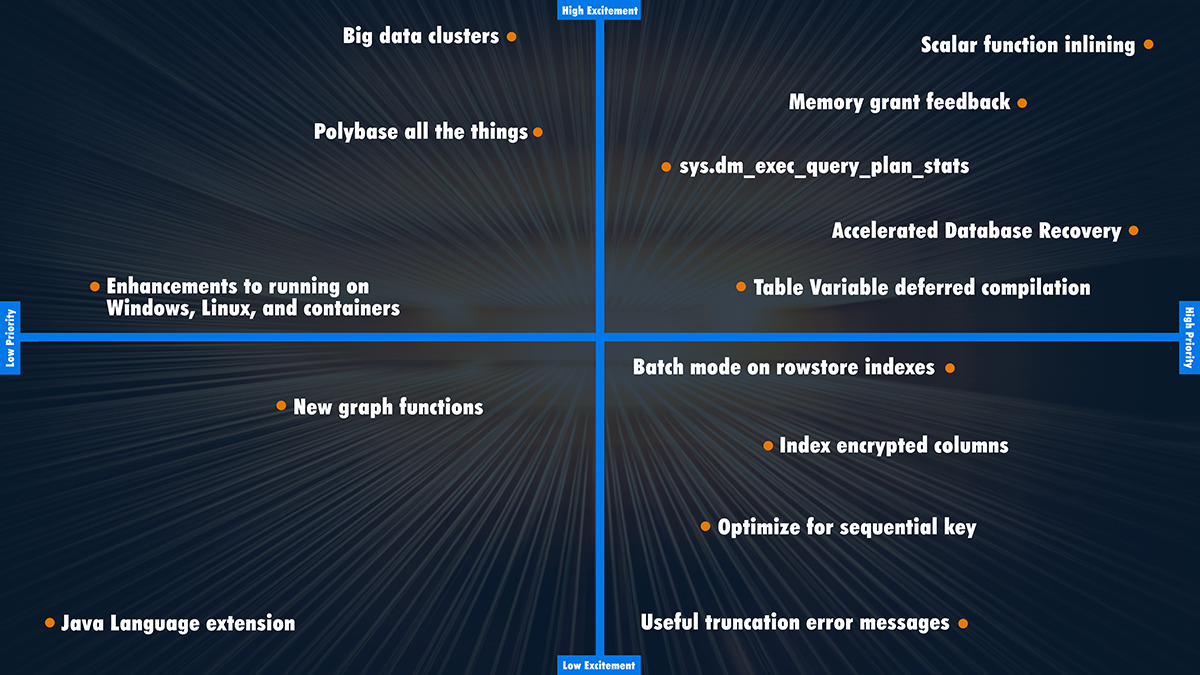
I decided to rank these features on two axes: Excitement and Priority

Excitement is easy to describe: how excited I am about using these features. In my case, excitement directly correlates with performance and developer usability improvements. That doesn't mean "Low Excitement" features aren't beneficial; on the contrary, many are great, they just don't top my list (it wouldn't be fun to have a quadrant with everything in the top right).

Priority is how quickly I'll work on implementing or tuning these features. The truth is that some of these features will work automatically once a SQL Server instance is upgraded, while some will require extra work (ie. query rewriting, hardware config). Once again, "Low Priority" features aren't bad, they just won't be the features that I focus on first.

Finally, these rankings are based on Microsoft's descriptions of these features and what little tinkering I've done with pre-releases of SQL Server 2019. As far as I know, this chart will totally change once I start using these features regularly in production environments.

And here are my rankings in list form in case that's more your style:

High Excitement, High Priority

  • Scalar function inlining
  • Memory grant feedback
  • sys.dm_exec_query_plan_stats
  • Accelerated Database Recovery
  • Table Variable deferred compilation

High Excitement, Low Priority

  • Big Data Clusters
  • Polybase all the things
  • Enhancements to running on Windows, Linux, and containers

Low Excitement, High Priority

  • Batch mode on rowstore indexes
  • Index encrypted columns
  • Optimize for sequential key
  • Useful truncation error messages

Low Excitement, Low Priority

  • New graph functions
  • Java language extension

What are you most excited for in 2019? What features did I miss? Disagree with where something should be ranked? Let me know in the comments below.

Are Stored Procedures Faster Than Stand-Alone Queries?

Watch this week's video on YouTube

A few months ago I was presenting for a user group when someone asked the following question:

Does a query embedded in a stored procedure execute faster than that same query submitted to SQL Server as a stand alone statement?

The room was pretty evenly split on the answer: some thought the stored procedures will always perform faster while others thought it wouldn't really matter.

In short, the answer is that the query optimizer will treat a query defined in a stored procedure exactly the same as a query submitted on its own.

Let's talk about why.

Start with a Plan

While submitting an "EXEC <stored procedure>" statement to SQL Server may require fewer packets of network traffic than submitting the several hundred (thousands?) lines that make up the query embedded in the procedure itself, that is where the efficiencies of a stored procedure end*.

*NOTE: There are certain SQL Server performance features, like temporary object cachingnatively compiled stored procedures for optimized tables, etc… that will improve the performance of a stored procedure over an ad hoc query. However in my experience, most people aren't utilizing these types of features so it's a moot point.

After receiving the query, SQL Server's query optimizer looks at these two submitted queries exactly the same. It will check to see if a cached plan already exists for either query (and if one does, it will use that), otherwise it will send both queries through the optimization process to find a suitable execution plan. If the standalone query and the query defined in the stored procedure are exactly the same, and all other conditions on the server are exactly the same at the time of execution, SQL Server will generate the same plans for both queries.

To prove this point, let's look at the following query's plan as well as the plan for a stored procedure containing that same query:

CREATE OR ALTER PROCEDURE dbo.USP_GetUpVotes
    @UserId int
AS
SELECT  
    COUNT(*) AS UpVotes 
FROM 
    dbo.Posts p
    INNER JOIN Votes v
        ON v.PostId = p.Id 
WHERE 
    p.OwnerUserId = @UserId
    and VoteTypeId = 2
ORDER BY UpVotes DESC


EXEC dbo.USP_GetUpVotes 23
DECLARE @UserId int = 23

SELECT 
    COUNT(*) AS UpVotes 
FROM 
    dbo.Posts p
    INNER JOIN Votes v
        ON v.PostId = p.Id 
WHERE 
    p.OwnerUserId = @UserId
    and VoteTypeId = 2
ORDER BY UpVotes DESC

.

As you can see, the optimizer generates identical plans for both the standalone query and the stored procedure. In the eyes of SQL Server, both of these queries will be executed in exactly the same way.

But I Swear My Stored Procedures Run Faster!

I think that a lot of the confusion for thinking that stored procedures execute faster comes from caching.

As I wrote about a little while back, SQL Server is very particular about needing every little detail about a query to be exactly the same in order for it to reuse its cached plan. This includes things like white space and case sensitivity.

It is much less likely that a query inside of a stored procedure will change compared to a query that is embedded in code. Because of this, it's probably more likely that your stored procedure plans are being ran from cached plans while your individually submitted query texts may not be utilizing the cache. Because of this, the stored procedure may in fact be executing faster because it was able to reuse a cached plan. But this is not a fair comparison - if both plans would pull from the cache, or if both plans had to generate new execution plans, they would both have the same execution performance.

So does it matter if I use stored procedures or not?

So while in the majority of cases a standalone query will perform just as quickly as that same query embedded in a store procedure I still think it's better to use stored procedures when possible.

First, embedding your query inside of a stored procedure increases the likelihood that SQL Server will reuse that query's cached execution plan as explained above.

Secondly, using stored procedures is cleaner for organization, storing all of your database logic in one location: the database itself.

Finally, and most importantly, using stored procedures gives your DBA better insight into your queries. Storing a query inside of a stored procedure means your DBA can easily access and analyze it, offering suggestions and advice on how to fix it in case it is performing poorly. If your queries are all embedded in your apps instead, it makes it harder for the DBA to see those queries, reducing the likelihood that they will be able to help you fix your performance issues in a timely manner.

Whitespace, Letter Case, and Other Things That Prevent Plan Reuse

Watch this week's video on YouTube

Last week's post briefly mentioned that SQL server may not reuse a query plan from cache if there is a small difference in whitespace.

In addition to differences in whitespace, SQL Server won't reuse query plans for a variety of reasons. Today's post will cover some of the more common scenarios of when a plan won't be reused.

Viewing the Cache

One way to view what's in SQL Server's query plan cache is by querying the sys.db_exec_query_stats DMV. Combined with the sys.dm_exec_sql_text and sys.dm_exec_query_plan functions, we can get an idea of what's in the cache and how often it's getting reused:

SELECT
    s.sql_handle,
    s.plan_generation_num,
    s.plan_handle,
    s.execution_count,
    s.query_hash,
    s.query_plan_hash,
    t.text,
    p.query_plan
FROM 
    sys.dm_exec_query_stats s
    CROSS APPLY sys.dm_exec_sql_text(sql_handle) t
    CROSS APPLY sys.dm_exec_query_plan(plan_handle) p

Now that we know how to view information about the query plan cache, let's run DBCC FREEPROCCACHE to clear it out so we can start with a clean slate (warning: probably a bad idea to run this in production).

Patterns That Prevent Plan Reuse

With our plan cache empty, let's run some similar queries and see if SQL Server decides to reuse plans, or insert nearly duplicate entries into the plan cache.

Whitespace

If we run these two queries:

SELECT TOP 100 DisplayName FROM dbo.Users;
GO
SELECT TOP 100 DisplayName FROM     dbo.Users;
GO

And then go check our query plan cache:

2019-09-02-19-06-37

We'll notice that SQL Server compiled two separate plans for what is essentially the same exact query (the only difference being the extra spaces before the table name). What this means is that if your queries are not exactly the same, or if you are in the habit of highlighting queries in SSMS before you run them (and accidently select some extra white space before/after your query), SQL Server will generate a brand new plan for you even though it has a compiled plan for a nearly identical query already in cache.

Don't think this can happen to you? While filming the video for this blog post, I accidently made this exact mistake even though I had reviewed my code and I was intentionally trying to show you what not to do. It's easy to slip up. Check out the blooper at 2:25 if interested.

Letter Case

Differences in letter casing also prevent cached plan reuse:

SELECT TOP 100 DisplayName FROM dbo.Users;
GO
select TOP 100 DisplayName from dbo.Users;
GO

2019-09-02-19-07-14

In this case, only our SELECT and FROM keywords have changed from upper to lower case, but in the eyes of SQL Server these queries are now different and it will generate plans individually for them.

Comments

Want to improve the clarity of your business logic with a comment? Great! But watch out if running the query with and without comments because SQL Server will consider these queries to be different:

SELECT TOP 100 DisplayName FROM dbo.Users;
GO
/* This query returns all user names */
SELECT TOP 100 DisplayName FROM dbo.Users;
GO

2019-09-02-19-07-46-1

Schema Names

Running the following two queries:

SELECT TOP 100 DisplayName FROM dbo.Users;
GO
SELECT TOP 100 DisplayName FROM Users;
GO

2019-09-02-19-08-11

These two queries create two separate entries in the plan cache. The problem here is that every user can have a different default schema, so if you don't prefix a table name with a schema, SQL Server won't be able to guarantee that each execution of the query should run for the same exact table, forcing it to generate new plans and prevent reuse.

SET Options

If you have two queries running with two different configurations of SET options, the queries will also generate separate plans:

SET ANSI_PADDING ON;
GO
SELECT TOP 100 DisplayName FROM dbo.Users;
GO
SET ANSI_PADDING OFF;
GO
SELECT TOP 100 DisplayName FROM dbo.Users;
GO

2019-09-02-19-08-53

Simple Parameterization Datatypes

If a query is simple enough for SQL Server to parameterize it on its own, we'll see the parameterize query usage count increase since SQL Server can reuse the query:

SELECT DisplayName FROM dbo.Users WHERE Id = 3;
GO
SELECT DisplayName FROM dbo.Users WHERE Id = 4;
GO

2019-09-02-19-11-45

However, you'll notice that SQL Server defined the parameterized value as tinyint. If our query suddenly sends in a value larger than 255:

SELECT DisplayName FROM dbo.Users WHERE Id = 256;
GO

2019-09-02-19-12-10

We'll see a new plan generated and stored in cache.

What is particularly interesting is that if we have differences in whitespace or comments in queries that can be simply parameterized, SQL Server will actually correct for this and be able to reuse the same plan even though queries without simple parameterization would fail to reuse the same plan:

SELECT DisplayName FROM dbo.Users WHERE Id = 3;
GO
SELECT DisplayName FROM dbo.Users WHERE Id = 3;
GO
SELECT DisplayName FROM dbo.Users WHERE Id = 3;
GO
SELECT DisplayName /*comment*/ FROM dbo.Users WHERE Id = 3;
GO

2019-09-02-19-12-47

Be Consistent

In conclusion, SQL Server is very particular about the differences in your submitted queries, no matter how small those differences may be. If you want SQL Server to be able to reuse plans from its cache, you need to make sure those queries are exactly the same.
How I Troubleshoot SQL Server Execution Plans

Watch this week's video on YouTube

Today I'm concluding my series on SQL Server execution plans by sharing the specific steps I take when troubleshooting a slow performing query.

Getting the Execution Plan

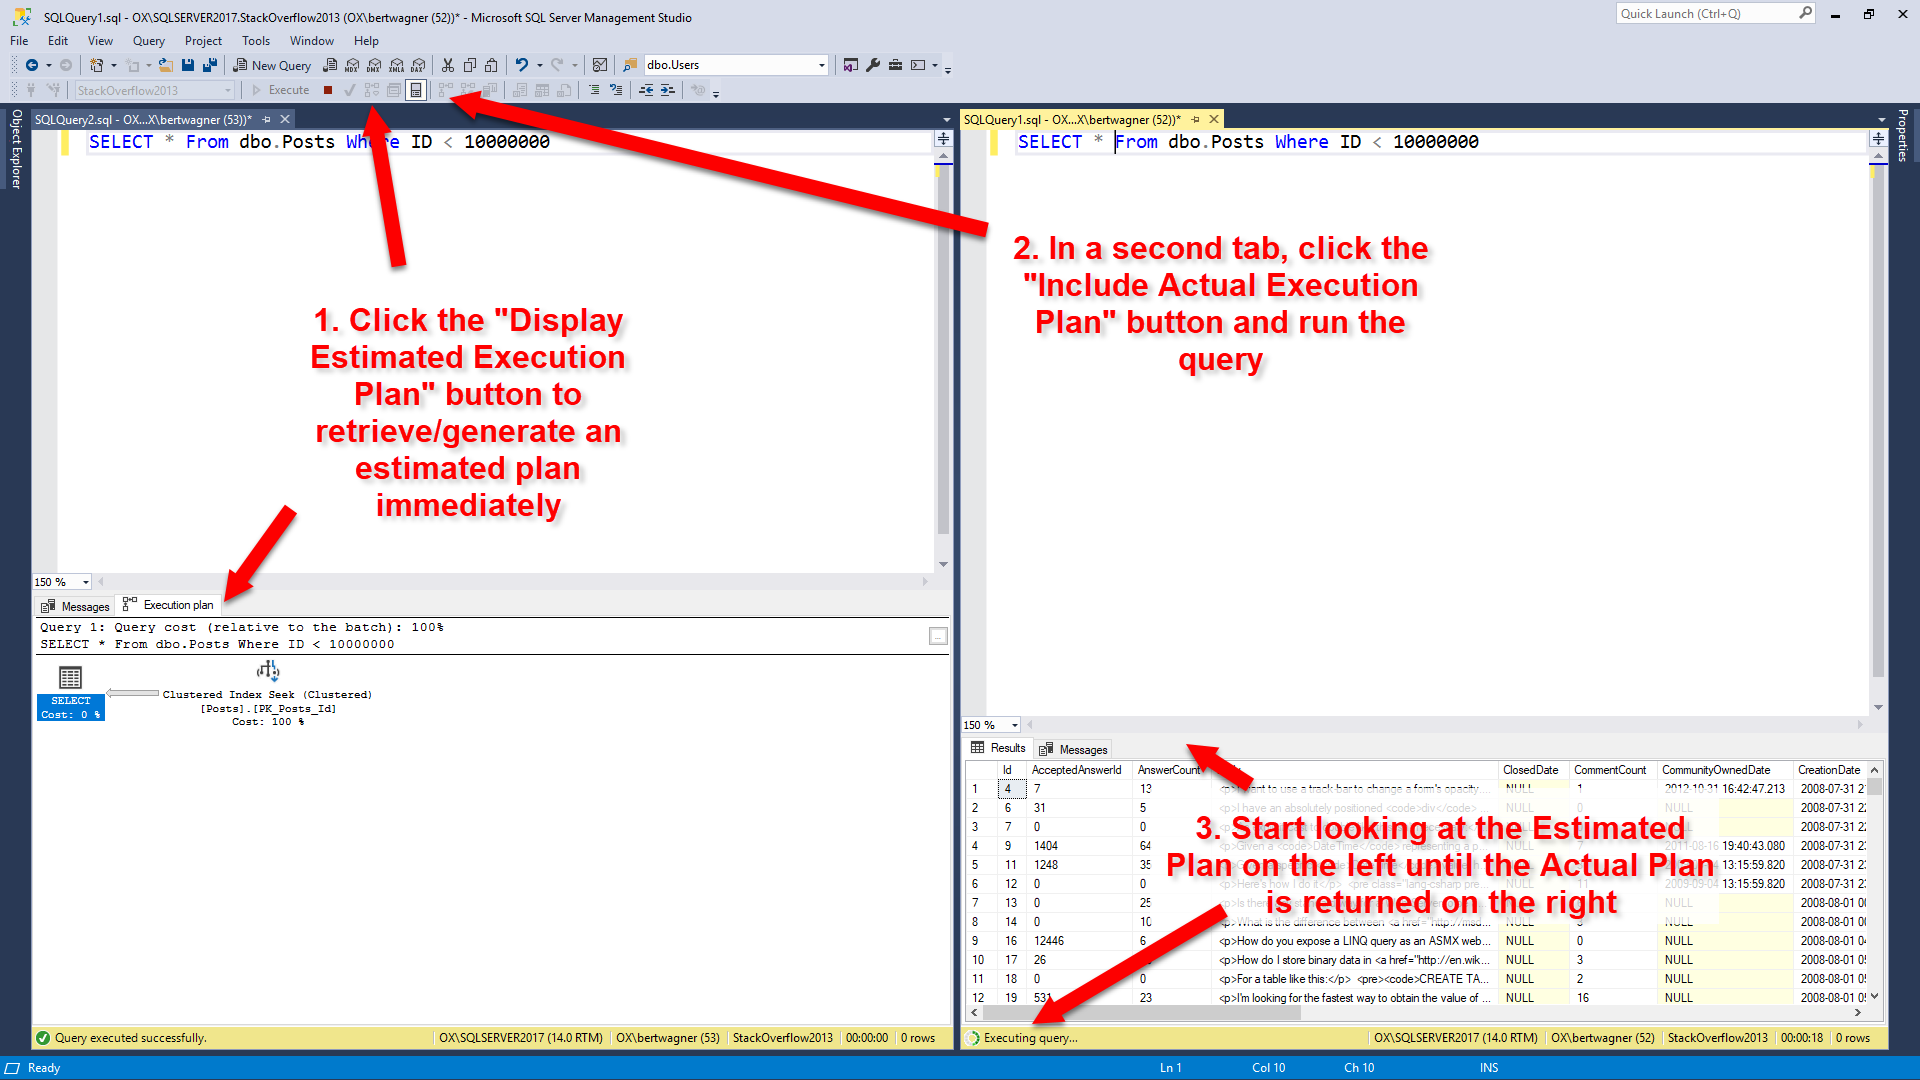
In part 1 of this series we discussed the different types of execution plans available and how to view them. My preference is to start with the poor performing query and request an execution plan for it.

2019-08-20-20-24-24

With the query pasted and formatted in my SSMS editor window, I like retrieving the estimated execution plan first, and then pasting the query into a second editor window and executing the query with the "Include Actual Execution Plan" option turned on. For bonus points, I'll split the SSMS window vertically so I can start looking at the estimated execution plan while the query runs and returns the actual execution plan: I like this combination because I (almost) immediately receive my estimated execution plan and can start looking for problems. Once the query on the right finishes executing and I get the actual plan with all of its lovely run-time stats, I usually switch to that looking at that one.

Some people take the opposite approach, looking at a cached query plan first before running the query to get a plan. This is fine too, but from my experience running the query first gives me some other data points to work with: is this query still running slowly, or was it a temporary issue? Did the person I'm reviewing the query for make some mistake and saw poor performance for some other unrelated reason? Getting the execution plan myself will help answer some of these questions.

livequerystatistics

But flaws exist with my process too. For example, running the query in an SSMS window may generate a new plan instead of reusing a cached plan (if something like white space is different between the two query texts). This is one of those things that is fine as long as you remember that's what could be happening. It even acts as a benefit because if you do get different query plans between your run and what exists in cache, then you know you might have a parameter sniffing problem. Finally, if the actual execution plan is impractical to retrieve (the query takes too long to run), then I will turn on Live Query Statistics: I don't start with this option because most queries I deal with will return by the time I finish looking over the estimated execution plan (and at that point the additional overhead of Live Query Statistics isn't worth it). But if I don't have time to wait for the actual plan to return, switching to Live Query Statistics and watching the long running query execute in real time will usually help diagnose the performance issue.

Unexpected Seeks vs Scans

Once I am viewing one of the execution plans above, one of the first things I check is where my data is being retrieved from.

If I see data coming primarily coming from nonclustered indexes, I feel pretty good that the data is being retrieved efficiently since only a limited number of columns are being returned and hopefully they are coming back in a beneficial sort order (this is going on the assumption that I keep my indexes pretty narrow to begin with).

If all I see are index scans, that may be fine, but I want to make sure:

  1. I am not seeing table scans - at the very least they should be clustered index scans,
  2. I am not using an unnecessary SELECT * in my query - why read in all of that extra data into memory or prevent a narrower index usage if I don't need it,
  3. SQL Server isn't scanning an entire index to return only a limit subset of rows

Finally, I like to double check any index seeks I see as part of key lookups. Once again, key lookups are not necessarily bad, but if I can include just one more column into a nonclustered index and get rid of the lookup, I may consider doing so if that part of the plan seems to be a bottleneck.

Inaccurate Row Estimates

Next I start looking at costly operators and checking their Actual Number of Rows vs Estimated Number of Rows values (for queries that don't return quickly, Live Query Statistics helps identify these easily). I may also look at the relative size of arrows to see if it looks like one operator is returning or reading significantly more rows than I would expect.

If Actual vs Estimated Number of Rows are vastly different (generally, if Actual is greater than Estimated by more than 100x), I start thinking about why SQL Server might be estimating the wrong number of rows by using common sense or looking at the statistics being used.

At this point I also consider whether the query is parameterized (either explicitly in the query or automatically by SQL Server). If it is, I usually start going down the path of checking for parameter sniffing.

Suspicious Operators

Next I look for any other commonly problematic operators in my plan: things like sorts, spools, hash joins, etc…

I've already covered these in a previous post of my Execution Plans series, but it's worth restating that I'm always keeping a look out for these operators.

Warnings

Finally, I quickly scan the plan for any yellow exclamation points present on any of the plan operators. These symbols indicate activities that SQL Server thinks it should warn us about. I also covered these in more detail in part 3, but it's worth mentioning again here because looking for these warnings can be a huge help in identifying the troublesome parts of your execution plan.

Conclusion

There is no one right way to troubleshoot or performance tune a query. I use the above method because it makes sense for my world where most of the queries I performance tune are my own and I have a pretty good knowledge of what other types of queries are running on my database. I hope sharing this process can help you develop your own preferred process for query tuning in your own environment.