Watch this week's video on YouTube
- Part 1: Introduction to Execution Plans
- Part 2: Overview of Statistics
- Part 3: Reading an Execution Plan
- Part 4: Commonly Troublesome Operators
- Part 5: Troubleshooting Execution Plans
I nearly always use execution plans as the starting point for SQL query performance troubleshooting. In this multi-part series, I plan to review the basics of execution plans and how you can use them to improve the performance of your own queries.
Execution Plans
SQL is a declarative language: instead of programming the details of how data should be retrieved, we describe what data we want and SQL Server figures out how it should return it to us.
For most queries that we want to performance tune, the SQL Server Query Optimizer considers multiple options for returning the data. It estimates the costs of these various approaches and lands on one that it thinks will return the data in an efficient manner. All of these options for retrieving the data are what are known as query execution plans.
Most of the time, this process works well and the Query Optimizer ends up choosing a query plan that returns the requested data quickly. This however does not mean that SQL Server chooses the "most efficient" query plan. Besides debating what "most efficient" means in different scenarios, SQL Server doesn't want to spend hours calculating every possible way to return your data when it only takes a fraction of that time to find a plan that is "good enough".
Problems arise when the Query Optimizer selects a query plan that isn't very good at all. This can happen due to a number of issues that we'll look at in future parts of this series.
Today we'll focus on learning how we can obtain execution plans for our queries.
Viewing Execution Plans
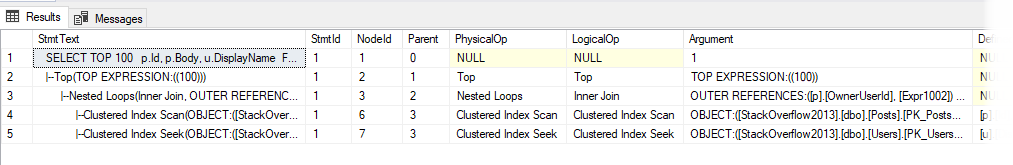
To see an execution plan for your query, you can run SET SHOWPLAN_ALL ON. This will provide a text-based tree representation of the plan:
SET SHOWPLAN_ALL ON
GO
--Query
GO
SET SHOWPLAN_ALL OFF
GO
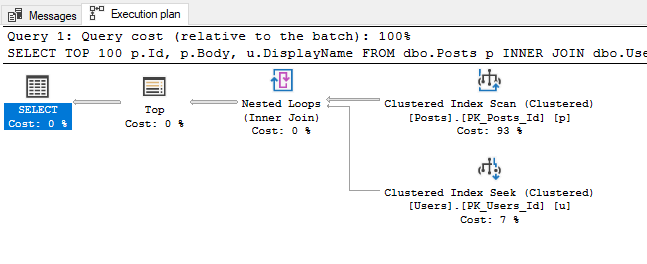
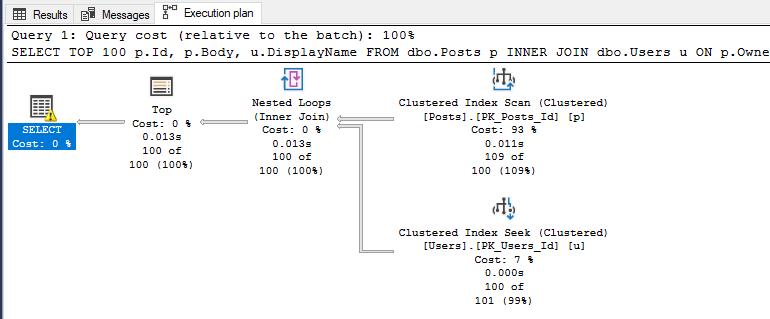
This may look familiar to you if you are used to looking at plans in other relational database environment that use similar tree-based plan explanations. In SSMS we have a a more visual option available to though. If we click the "Display Estimated Execution Plan" button or run SET SHOWPLAN_XML ON and execute our query, we will get our graphical execution plan:

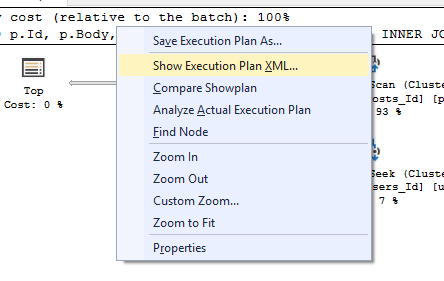
This graphical representation is my personal preference (and what we will be mostly focusing on in this series) but it's important to know that as hinted by the last command, you can also right click on this graphical execution plan and choose "Show Execution Plan XML" to see the XML that is driving all of the visuals:
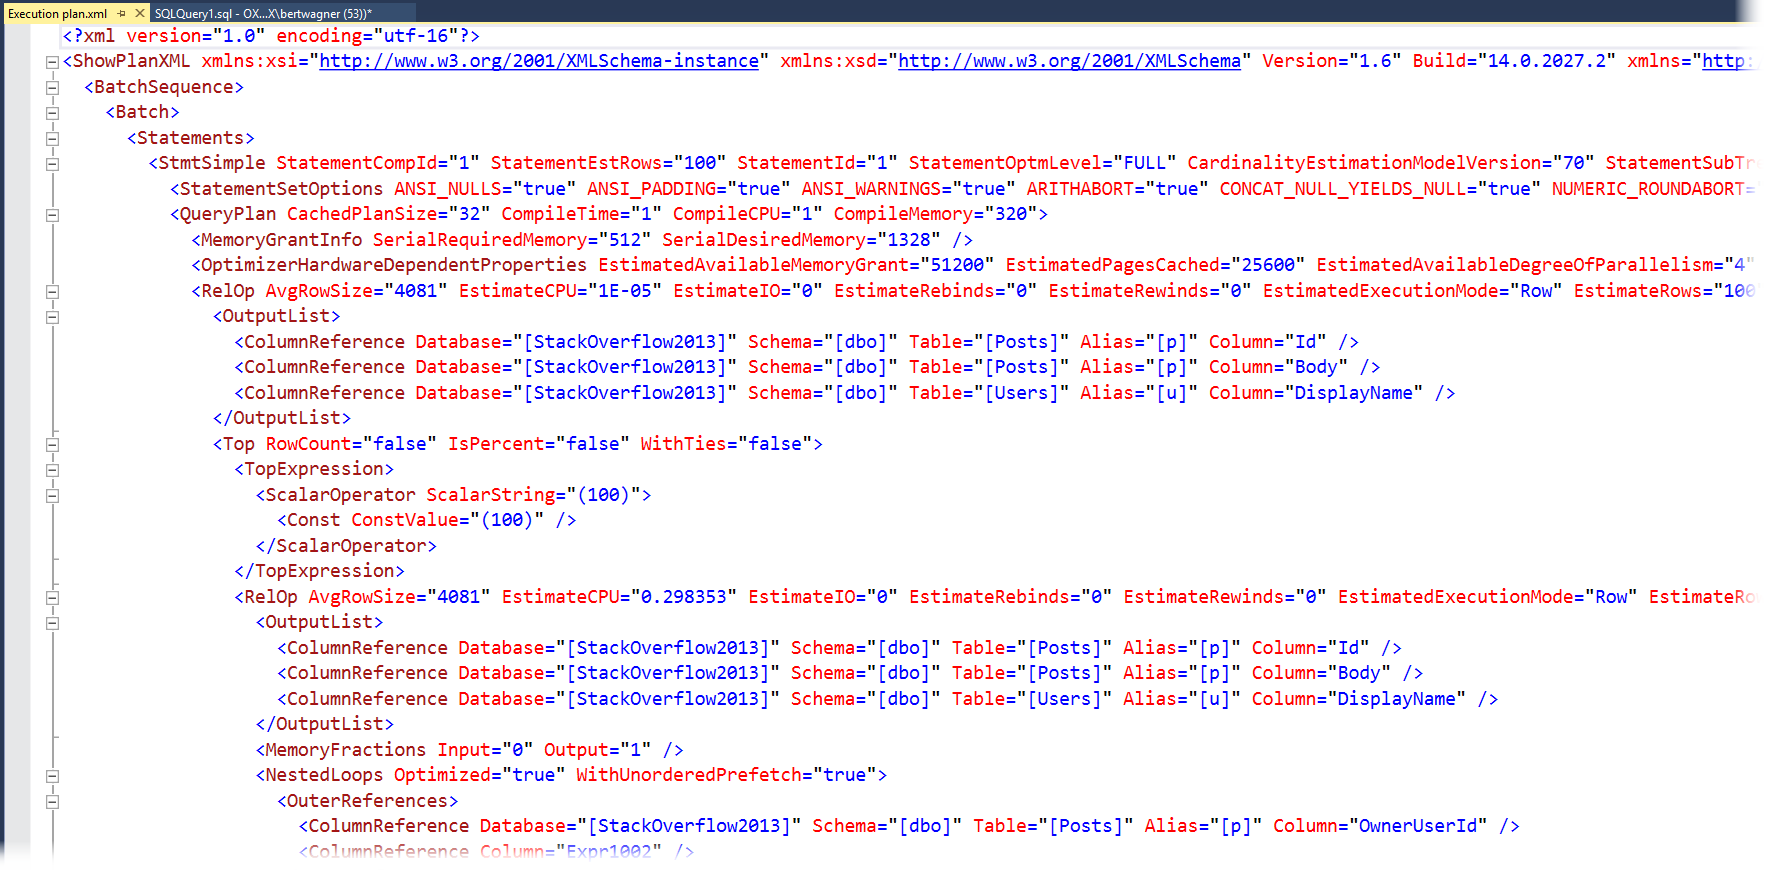
While most people don't find the XML as easy to digest as the graphical execution plan, it's worth knowing it is there: sometimes you will have to dive into the XML to find properties that don't get displayed in the graphical version.
Actual Plans
So far, every plan we've looked at is what's known as an "estimated" execution plan. The "estimated" name means it only contains "estimates" of how many rows will be processed based on internal meta data that SQL Server has available. You can view the "actual" execution plan by selecting the appropriate icon in SSMS:

There often confusion that occurs due to the naming of "estimated" vs "actual" execution plans. The difference is that the estimated plan is calculated before executing the SQL statement so it only has estimated meta data available for it to display, whereas the actual execution plan is that same estimated execution plan overlayed with runtime information like how many rows were processed, how much memory was used, etc…
Live Query Statistics
Live Query statistics give you the best of both estimated and actual execution plans. With Live Query Statistics enabled, SQL Server provides the estimated execution plan but overlays live runtime statistics on top of the plan as the query is executing in real-time.

Live Query Statistics are nice because they allow you to often see "where" in the execution plan a query is experiencing a performance bottleneck. This is particularly helpful if you are new to analyzing execution plans and haven't yet learned all of the common signs and operators that might indicate poor performance. It is also helpful when your query is performing so poorly that you are unable to retrieve an actual plan for it (since it executes for what seems like forever).
Historical Plans
Calculating query plans isn't free, so SQL Server caches query plans for reuse. These cached plans can be viewed in the sys.dm_exec_query_plan DMV:
SELECT
    *
FROM
    sys.dm_exec_cached_plans
    CROSS APPLY sys.dm_exec_query_plan(plan_handle)
    CROSS APPLY  sys.dm_exec_sql_text(plan_handle)
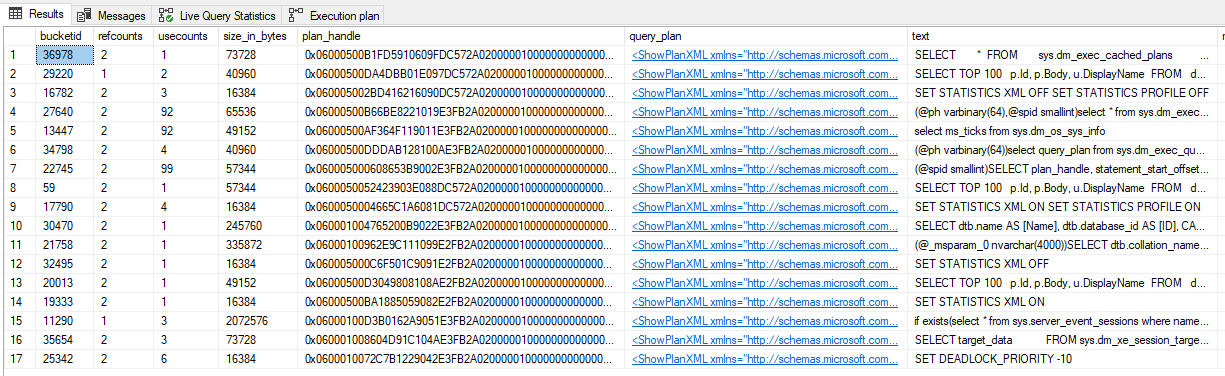
It's worth noting that this set of DMVs only show plans that are still in the cache and do not show actual plan statistics in them (plus some other limitations).
If you have Query Store enabled on your database, you can also access the query plans stored in the Query Store DMVs (or via the Query Store GUI):
SELECT
    CAST(p.query_plan AS XML),
    *
FROM
    sys.query_store_query AS q
    INNER JOIN sys.query_store_plan AS p
        ON q.query_id = p.query_id
Conclusion
Regardless of how and where you decide to retrieve your execution plan from, all of the above techniques will help provide insight into how SQL Server is obtaining the data that you specified in your query.