Watch this week's video on YouTube
- Part 1: Introduction to Execution Plans
- Part 2: Overview of Statistics
- Part 3: Reading an Execution Plan
- Part 4: Commonly Troublesome Operators
- Part 5: Troubleshooting Execution Plans
In the first part of this series I explained what an execution plan is and how to view one. Last week I threw you a curve ball and didn't show you any execution plans at all, instead focusing on the statistics data that helps SQL Server generate query plans. This week, we'll finally dive into what you need to know to read an execution plan.
Execution Plan Order
Execution plans show the steps SQL Server takes to execute your query. Each icon in the graphical execution plan is known as an operator, and the most common way to read a plan is by starting with the top right most operator and following the arrows to the left.
When you reach a join or concatenation operator where multiple branches merge into one operator, you can proceed to the right-most operator of one of the lower branches and start the process of reading right to left again. In general, this can be summed up as reading a plan right to left, top to bottom.
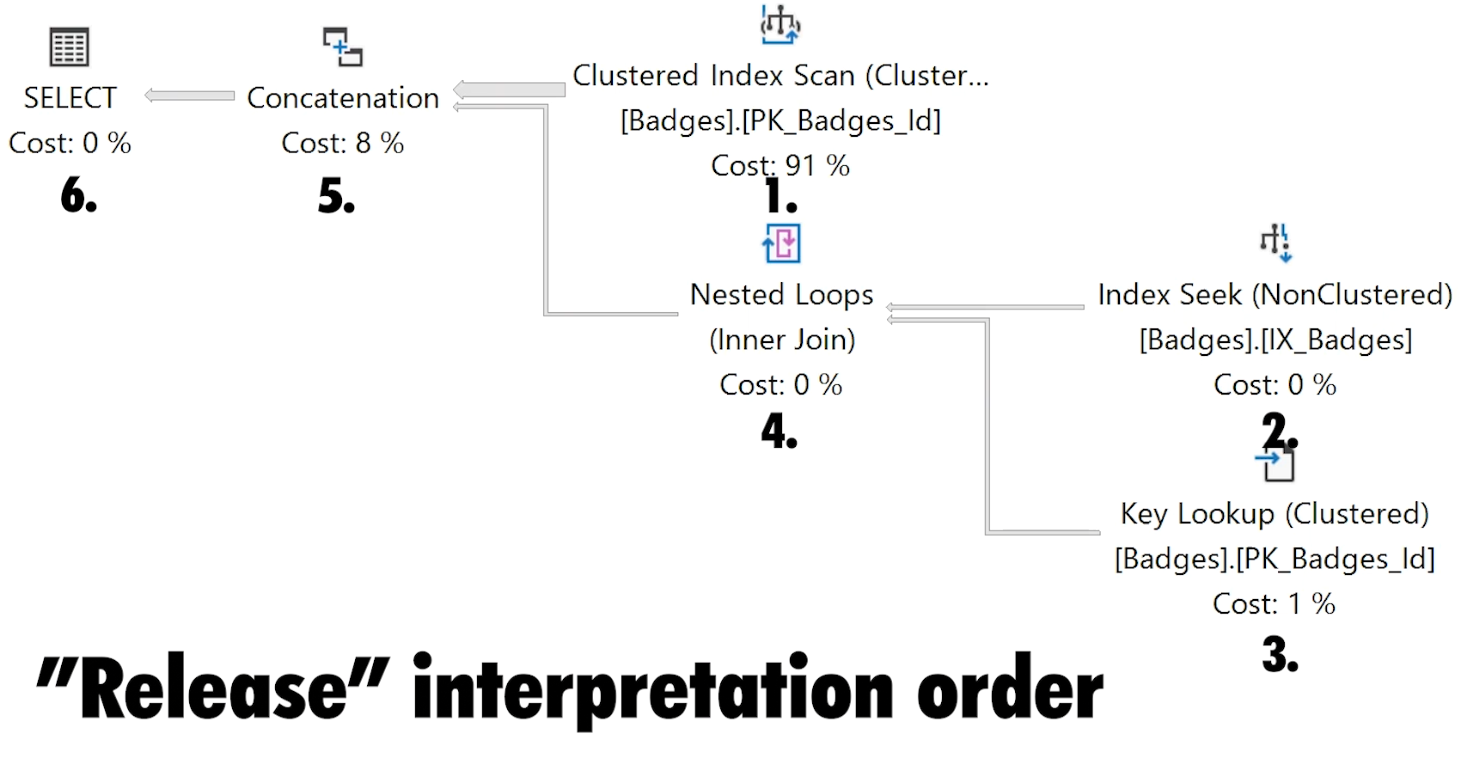
By following the arrows from one operator to the next, you are following the flow of data through the plan. Each operator releases a row of data to the operator immediately to the left of it until all of the data rows have made their way to the left most operator.
Arrows
Arrows identify the direction of data flow between operators.
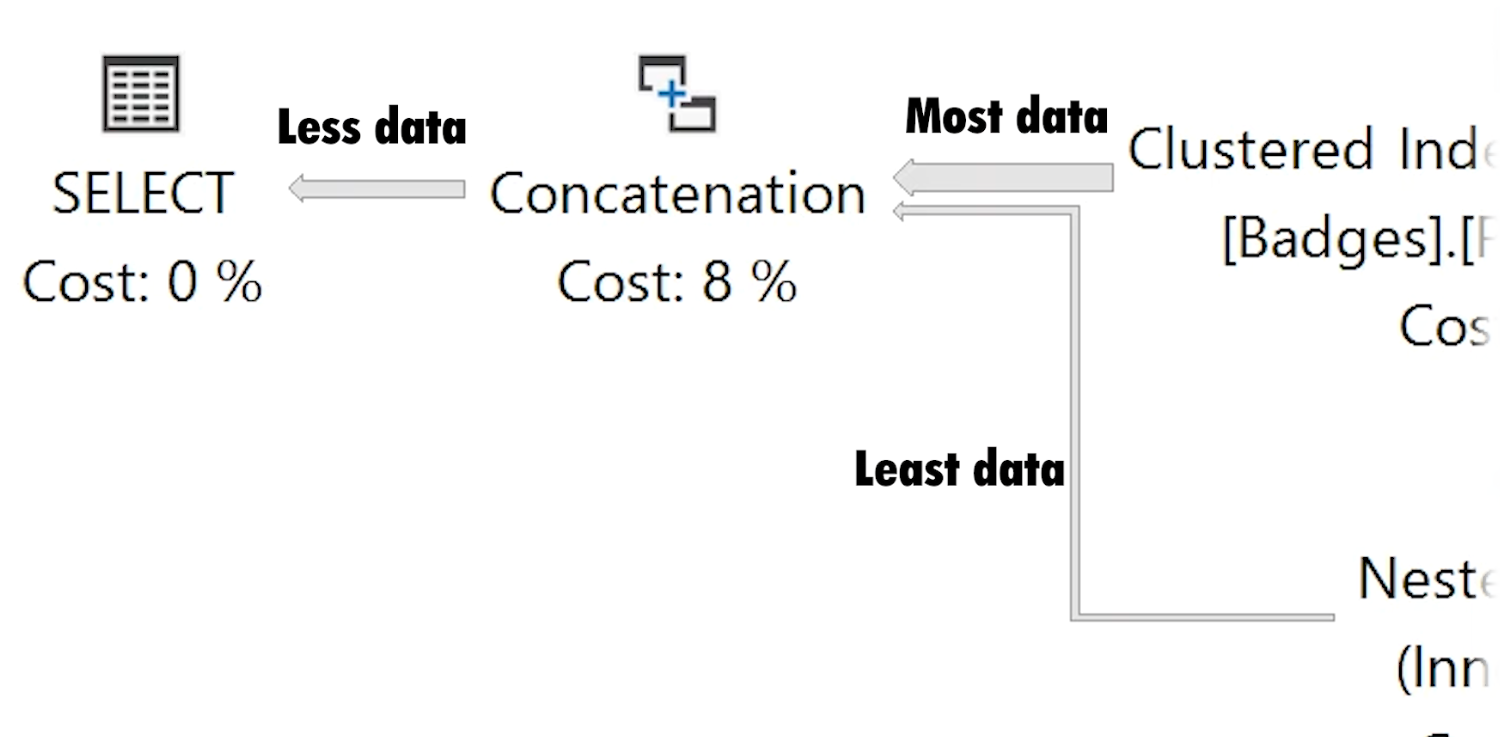
In a SQL Server Management Studio execution plan, they also represent the relative size of the data at that step. Brent Ozar recently wrote a detailed post demoing the differences between arrow sizes between estimated and actual execution plans. In summary, the arrow size represents the estimated number of rows output from the source operator in estimated execution plans, and the number of rows read by the source operator in actual execution plans.
When troubleshooting plans, these relative arrow sizes can be helpful to tip you off of where you might be seeing more data than you expected in your plans.
Operator properties
Hovering over an operator (or an arrow) gives us additional information about what that operator is doing. Not only does the hover overlay provide a description of an operator, it also shows us the number of rows SQL Server expected to read during this step versus what it actually read (if using the actual execution plan), what predicates were applied, warning messages, and more.
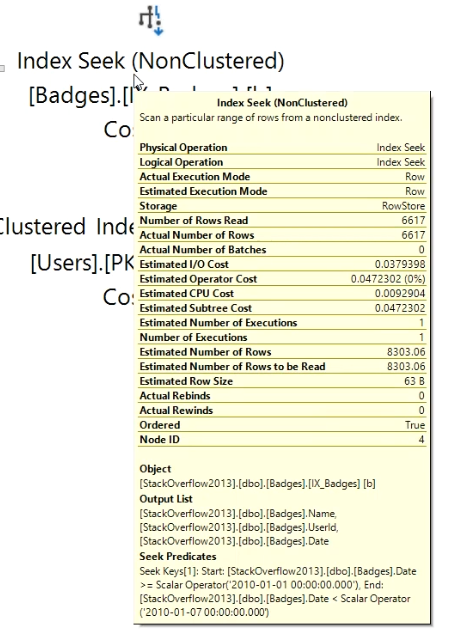
Bringing up the properties window (F4 by default) with an operator selected will provide even more information. I typically find myself looking in these properties to discover memory and CPU thread usage, and what transformations SQL Server is doing as part of my query execution.
Costs
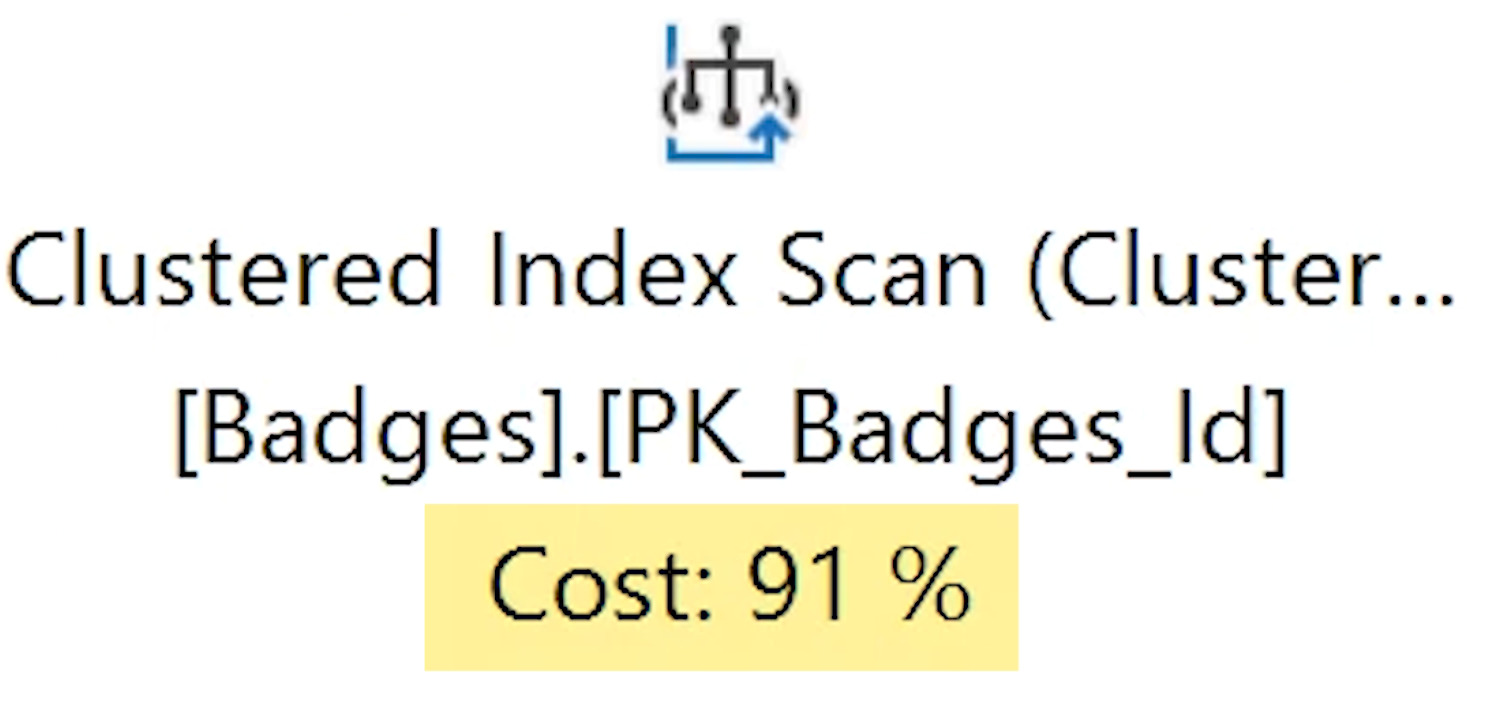
Under each operator you will notice the percentage cost of that operator relative to all other costs in the plan. These relative costs can sometimes help highlight where the major pain points in your execution plan are occurring.
I say sometimes because these execution plan costs are known to not always be accurate. Starting off your query performance troubleshooting session by identifying the high cost operators can be a good starting point, but you never want to rely on these cost numbers alone.
Warnings
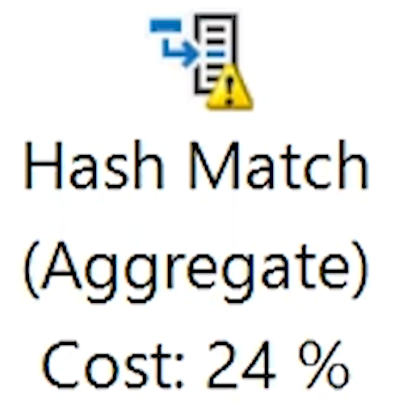
Warnings, denoted by a yellow exclamation point icon on the corner of the operator icon, indicate that something undesirable may be happening with that operator.
The usual culprits for these warnings are things are operators spilling to tempdb, implicit conversions that SQL Server has to make for a comparison (that potentially prevent an index from being used), and SQL Server telling you that it over/underestimated the amount of memory it needs to use for the query you are executing.
All of these problems might negatively impact query performance so it's always worth taking a look at the warning to see if it is important enough to correct.
Index Recommendations

If SQL Server thinks your query's performance can be improved with an index, it will tell you in reassuring green text at the top of your execution plan. How helpful!
The only catch is that these index recommendations usually aren't ready to use. It's not that they are bad, it's just that they are often incomplete, missing additional columns you could include to make your queries even more efficient than what the base recommendation suggests.
So while these recommendations are a good starting point, you should always give them some additional attention to see if you can improve them further.
