Watch this week's video on YouTube
- Part 1: Introduction to Execution Plans
- Part 2: Overview of Statistics
- Part 3: Reading an Execution Plan
- Part 4: Commonly Troublesome Operators
- Part 5: Troubleshooting Execution Plans
Today I'm concluding my series on SQL Server execution plans by sharing the specific steps I take when troubleshooting a slow performing query.
Getting the Execution Plan
In part 1 of this series we discussed the different types of execution plans available and how to view them. My preference is to start with the poor performing query and request an execution plan for it.
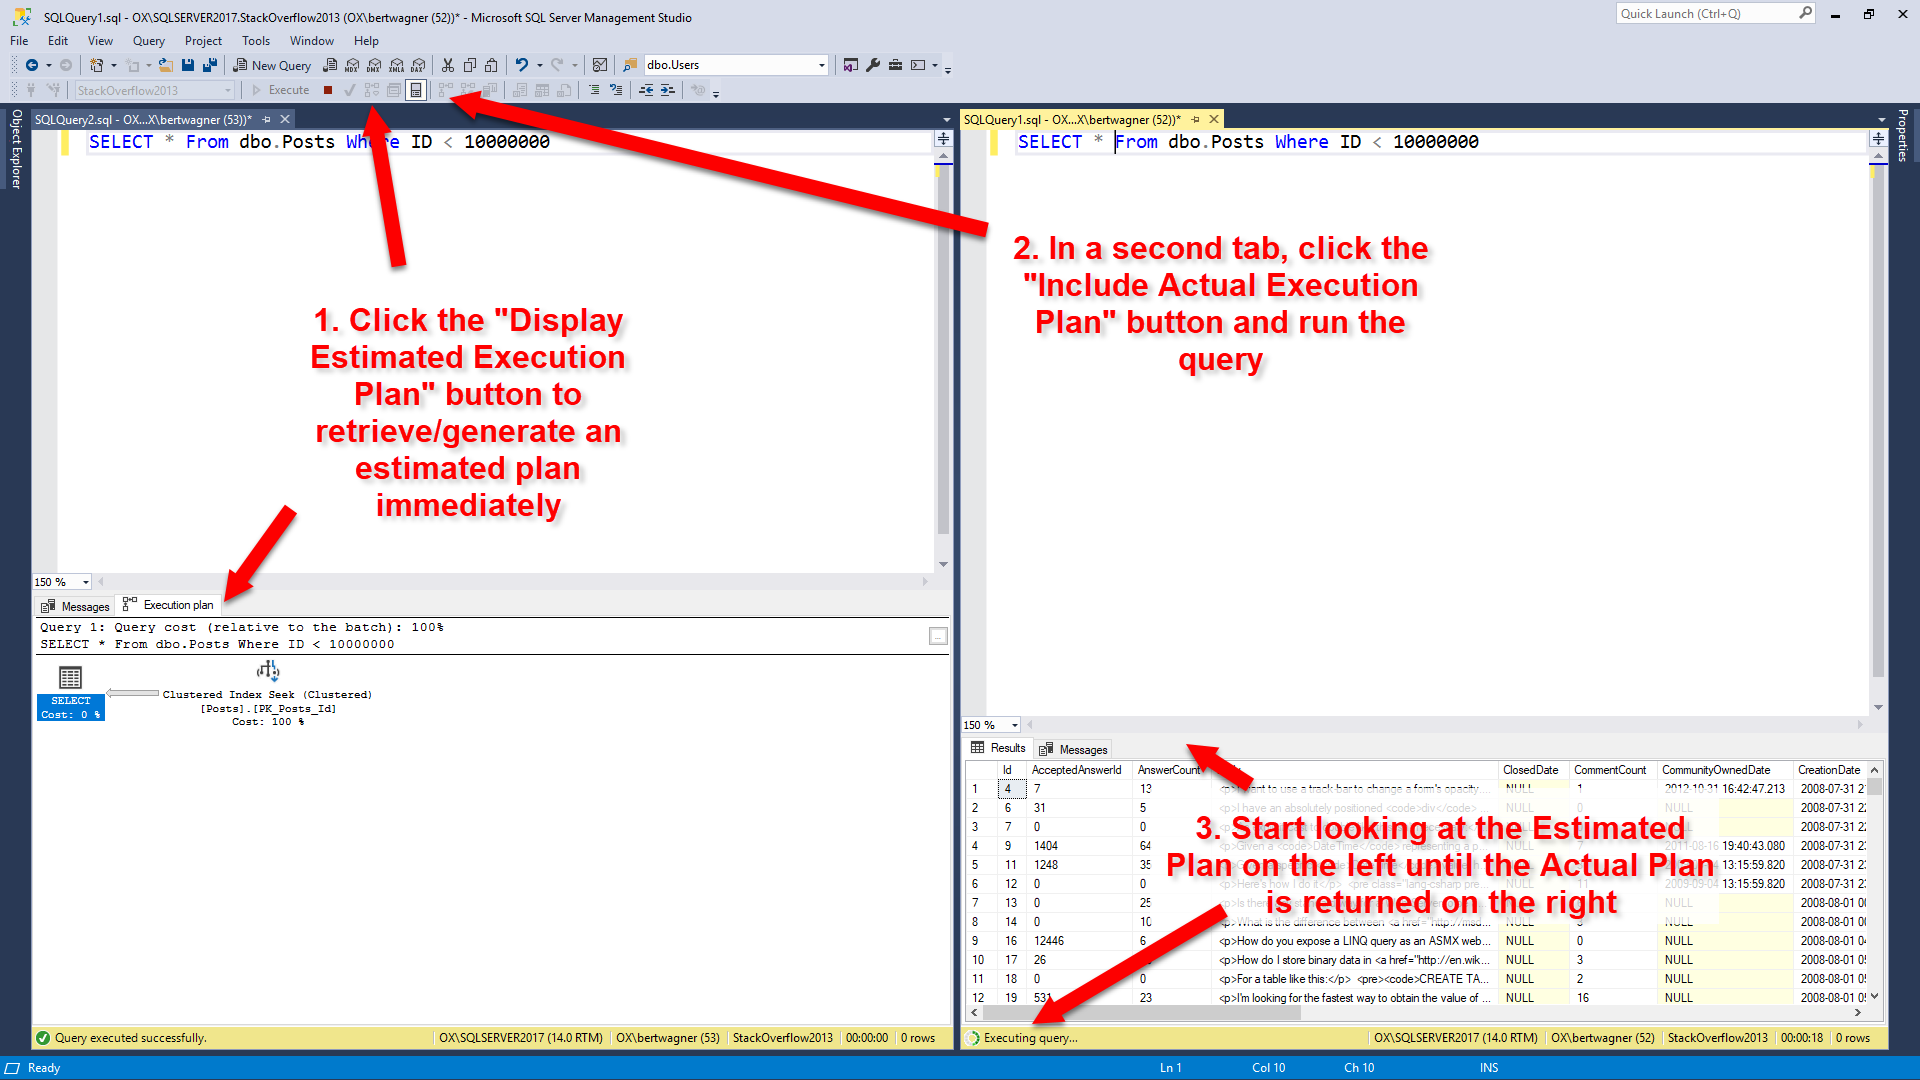
With the query pasted and formatted in my SSMS editor window, I like retrieving the estimated execution plan first, and then pasting the query into a second editor window and executing the query with the "Include Actual Execution Plan" option turned on. For bonus points, I'll split the SSMS window vertically so I can start looking at the estimated execution plan while the query runs and returns the actual execution plan: I like this combination because I (almost) immediately receive my estimated execution plan and can start looking for problems. Once the query on the right finishes executing and I get the actual plan with all of its lovely run-time stats, I usually switch to that looking at that one.
Some people take the opposite approach, looking at a cached query plan first before running the query to get a plan. This is fine too, but from my experience running the query first gives me some other data points to work with: is this query still running slowly, or was it a temporary issue? Did the person I'm reviewing the query for make some mistake and saw poor performance for some other unrelated reason? Getting the execution plan myself will help answer some of these questions.

But flaws exist with my process too. For example, running the query in an SSMS window may generate a new plan instead of reusing a cached plan (if something like white space is different between the two query texts). This is one of those things that is fine as long as you remember that's what could be happening. It even acts as a benefit because if you do get different query plans between your run and what exists in cache, then you know you might have a parameter sniffing problem. Finally, if the actual execution plan is impractical to retrieve (the query takes too long to run), then I will turn on Live Query Statistics: I don't start with this option because most queries I deal with will return by the time I finish looking over the estimated execution plan (and at that point the additional overhead of Live Query Statistics isn't worth it). But if I don't have time to wait for the actual plan to return, switching to Live Query Statistics and watching the long running query execute in real time will usually help diagnose the performance issue.
Unexpected Seeks vs Scans
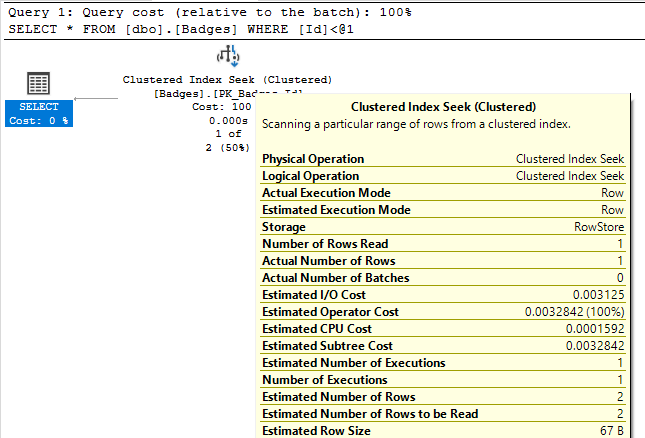
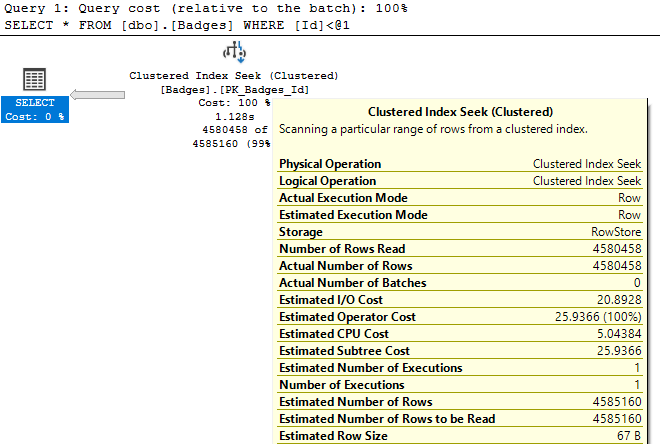
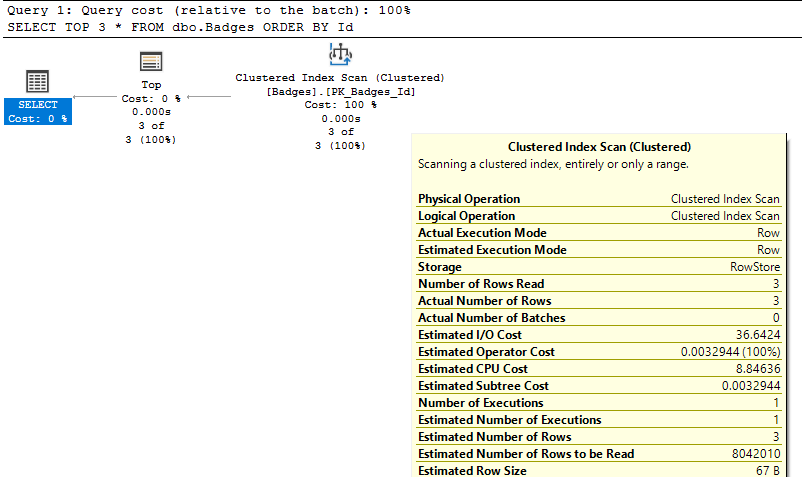
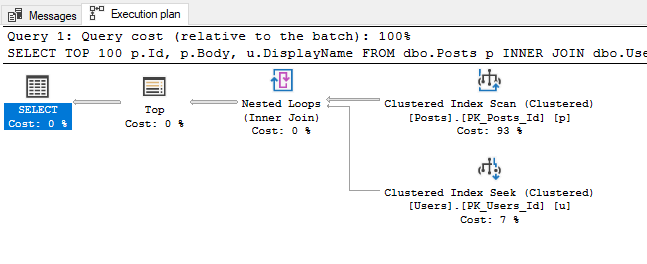
Once I am viewing one of the execution plans above, one of the first things I check is where my data is being retrieved from.
If I see data coming primarily coming from nonclustered indexes, I feel pretty good that the data is being retrieved efficiently since only a limited number of columns are being returned and hopefully they are coming back in a beneficial sort order (this is going on the assumption that I keep my indexes pretty narrow to begin with).
If all I see are index scans, that may be fine, but I want to make sure:
- I am not seeing table scans - at the very least they should be clustered index scans,
- I am not using an unnecessary
SELECT *in my query - why read in all of that extra data into memory or prevent a narrower index usage if I don't need it, - SQL Server isn't scanning an entire index to return only a limit subset of rows
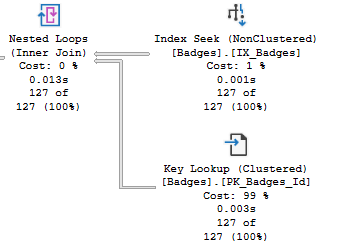
Finally, I like to double check any index seeks I see as part of key lookups. Once again, key lookups are not necessarily bad, but if I can include just one more column into a nonclustered index and get rid of the lookup, I may consider doing so if that part of the plan seems to be a bottleneck.
Inaccurate Row Estimates
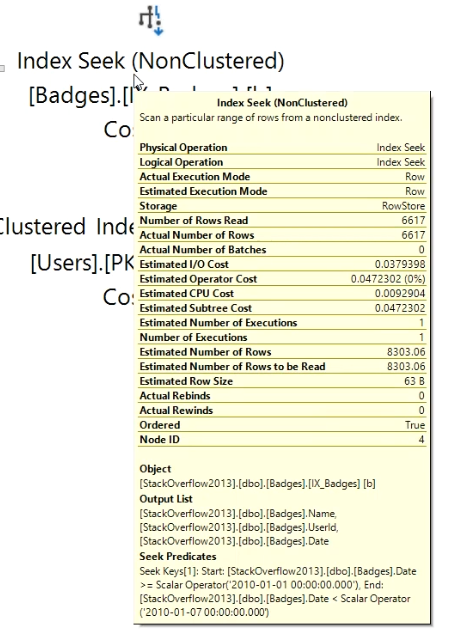
Next I start looking at costly operators and checking their Actual Number of Rows vs Estimated Number of Rows values (for queries that don't return quickly, Live Query Statistics helps identify these easily). I may also look at the relative size of arrows to see if it looks like one operator is returning or reading significantly more rows than I would expect.
If Actual vs Estimated Number of Rows are vastly different (generally, if Actual is greater than Estimated by more than 100x), I start thinking about why SQL Server might be estimating the wrong number of rows by using common sense or looking at the statistics being used.
At this point I also consider whether the query is parameterized (either explicitly in the query or automatically by SQL Server). If it is, I usually start going down the path of checking for parameter sniffing.
Suspicious Operators
Next I look for any other commonly problematic operators in my plan: things like sorts, spools, hash joins, etc…
I've already covered these in a previous post of my Execution Plans series, but it's worth restating that I'm always keeping a look out for these operators.
Warnings
Finally, I quickly scan the plan for any yellow exclamation points present on any of the plan operators. These symbols indicate activities that SQL Server thinks it should warn us about. I also covered these in more detail in part 3, but it's worth mentioning again here because looking for these warnings can be a huge help in identifying the troublesome parts of your execution plan.
Conclusion
There is no one right way to troubleshoot or performance tune a query. I use the above method because it makes sense for my world where most of the queries I performance tune are my own and I have a pretty good knowledge of what other types of queries are running on my database. I hope sharing this process can help you develop your own preferred process for query tuning in your own environment.

