Watch this week's video on YouTube
Last week's post briefly mentioned that SQL server may not reuse a query plan from cache if there is a small difference in whitespace.
In addition to differences in whitespace, SQL Server won't reuse query plans for a variety of reasons. Today's post will cover some of the more common scenarios of when a plan won't be reused.
Viewing the Cache
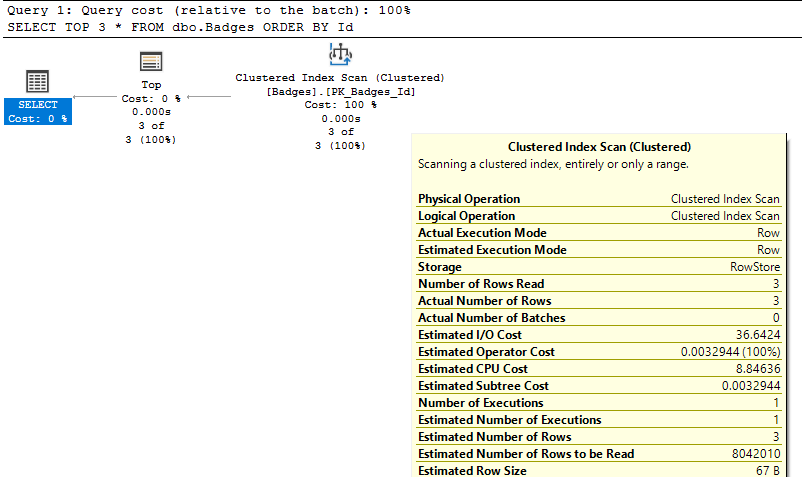
One way to view what's in SQL Server's query plan cache is by querying the sys.db_exec_query_stats DMV. Combined with the sys.dm_exec_sql_text and sys.dm_exec_query_plan functions, we can get an idea of what's in the cache and how often it's getting reused:
SELECT
    s.sql_handle,
    s.plan_generation_num,
    s.plan_handle,
    s.execution_count,
    s.query_hash,
    s.query_plan_hash,
    t.text,
    p.query_plan
FROM
    sys.dm_exec_query_stats s
    CROSS APPLY sys.dm_exec_sql_text(sql_handle) t
    CROSS APPLY sys.dm_exec_query_plan(plan_handle) p
Now that we know how to view information about the query plan cache, let's run DBCC FREEPROCCACHE to clear it out so we can start with a clean slate (warning: probably a bad idea to run this in production).
Patterns That Prevent Plan Reuse
With our plan cache empty, let's run some similar queries and see if SQL Server decides to reuse plans, or insert nearly duplicate entries into the plan cache.
Whitespace
If we run these two queries:
SELECT TOP 100 DisplayName FROM dbo.Users;
GO
SELECT TOP 100 DisplayName FROM     dbo.Users;
GO
And then go check our query plan cache:

We'll notice that SQL Server compiled two separate plans for what is essentially the same exact query (the only difference being the extra spaces before the table name). What this means is that if your queries are not exactly the same, or if you are in the habit of highlighting queries in SSMS before you run them (and accidently select some extra white space before/after your query), SQL Server will generate a brand new plan for you even though it has a compiled plan for a nearly identical query already in cache.
Don't think this can happen to you? While filming the video for this blog post, I accidently made this exact mistake even though I had reviewed my code and I was intentionally trying to show you what not to do. It's easy to slip up. Check out the blooper at 2:25 if interested.
Letter Case
Differences in letter casing also prevent cached plan reuse:
SELECT TOP 100 DisplayName FROM dbo.Users;
GO
select TOP 100 DisplayName from dbo.Users;
GO

In this case, only our SELECT and FROM keywords have changed from upper to lower case, but in the eyes of SQL Server these queries are now different and it will generate plans individually for them.
Comments
Want to improve the clarity of your business logic with a comment? Great! But watch out if running the query with and without comments because SQL Server will consider these queries to be different:
SELECT TOP 100 DisplayName FROM dbo.Users;
GO
/* This query returns all user names */
SELECT TOP 100 DisplayName FROM dbo.Users;
GO

Schema Names
Running the following two queries:
SELECT TOP 100 DisplayName FROM dbo.Users;
GO
SELECT TOP 100 DisplayName FROM Users;
GO

These two queries create two separate entries in the plan cache. The problem here is that every user can have a different default schema, so if you don't prefix a table name with a schema, SQL Server won't be able to guarantee that each execution of the query should run for the same exact table, forcing it to generate new plans and prevent reuse.
SET Options
If you have two queries running with two different configurations of SET options, the queries will also generate separate plans:
SET ANSI_PADDING ON;
GO
SELECT TOP 100 DisplayName FROM dbo.Users;
GO
SET ANSI_PADDING OFF;
GO
SELECT TOP 100 DisplayName FROM dbo.Users;
GO

Simple Parameterization Datatypes
If a query is simple enough for SQL Server to parameterize it on its own, we'll see the parameterize query usage count increase since SQL Server can reuse the query:
SELECT DisplayName FROM dbo.Users WHERE Id = 3;
GO
SELECT DisplayName FROM dbo.Users WHERE Id = 4;
GO

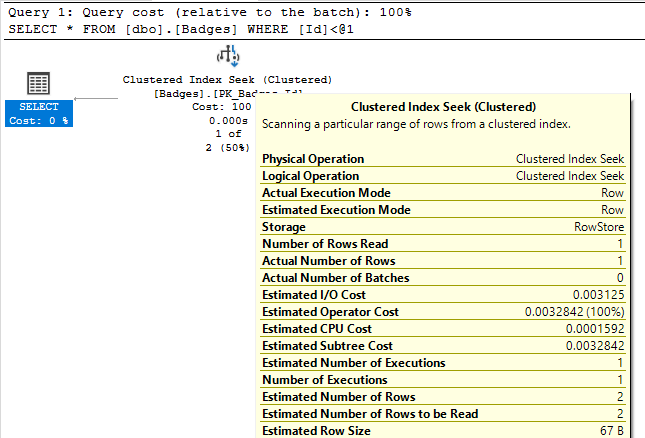
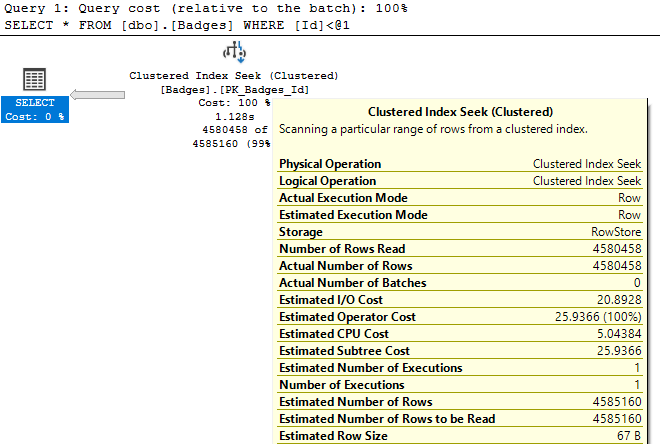
However, you'll notice that SQL Server defined the parameterized value as tinyint. If our query suddenly sends in a value larger than 255:
SELECT DisplayName FROM dbo.Users WHERE Id = 256;
GO

We'll see a new plan generated and stored in cache.
What is particularly interesting is that if we have differences in whitespace or comments in queries that can be simply parameterized, SQL Server will actually correct for this and be able to reuse the same plan even though queries without simple parameterization would fail to reuse the same plan:
SELECT DisplayName FROM dbo.Users WHERE Id = 3;
GO
SELECT DisplayName FROM dbo.Users WHERE Id = 3;
GO
SELECT DisplayName FROM dbo.Users WHERE Id = 3;
GO
SELECT DisplayName /*comment*/ FROM dbo.Users WHERE Id = 3;
GO

Be Consistent
In conclusion, SQL Server is very particular about the differences in your submitted queries, no matter how small those differences may be. If you want SQL Server to be able to reuse plans from its cache, you need to make sure those queries are exactly the same.