Data with Bert logo

How I Troubleshoot SQL Server Execution Plans

Watch this week's video on YouTube

Today I'm concluding my series on SQL Server execution plans by sharing the specific steps I take when troubleshooting a slow performing query.

Getting the Execution Plan

In part 1 of this series we discussed the different types of execution plans available and how to view them. My preference is to start with the poor performing query and request an execution plan for it.

2019-08-20-20-24-24

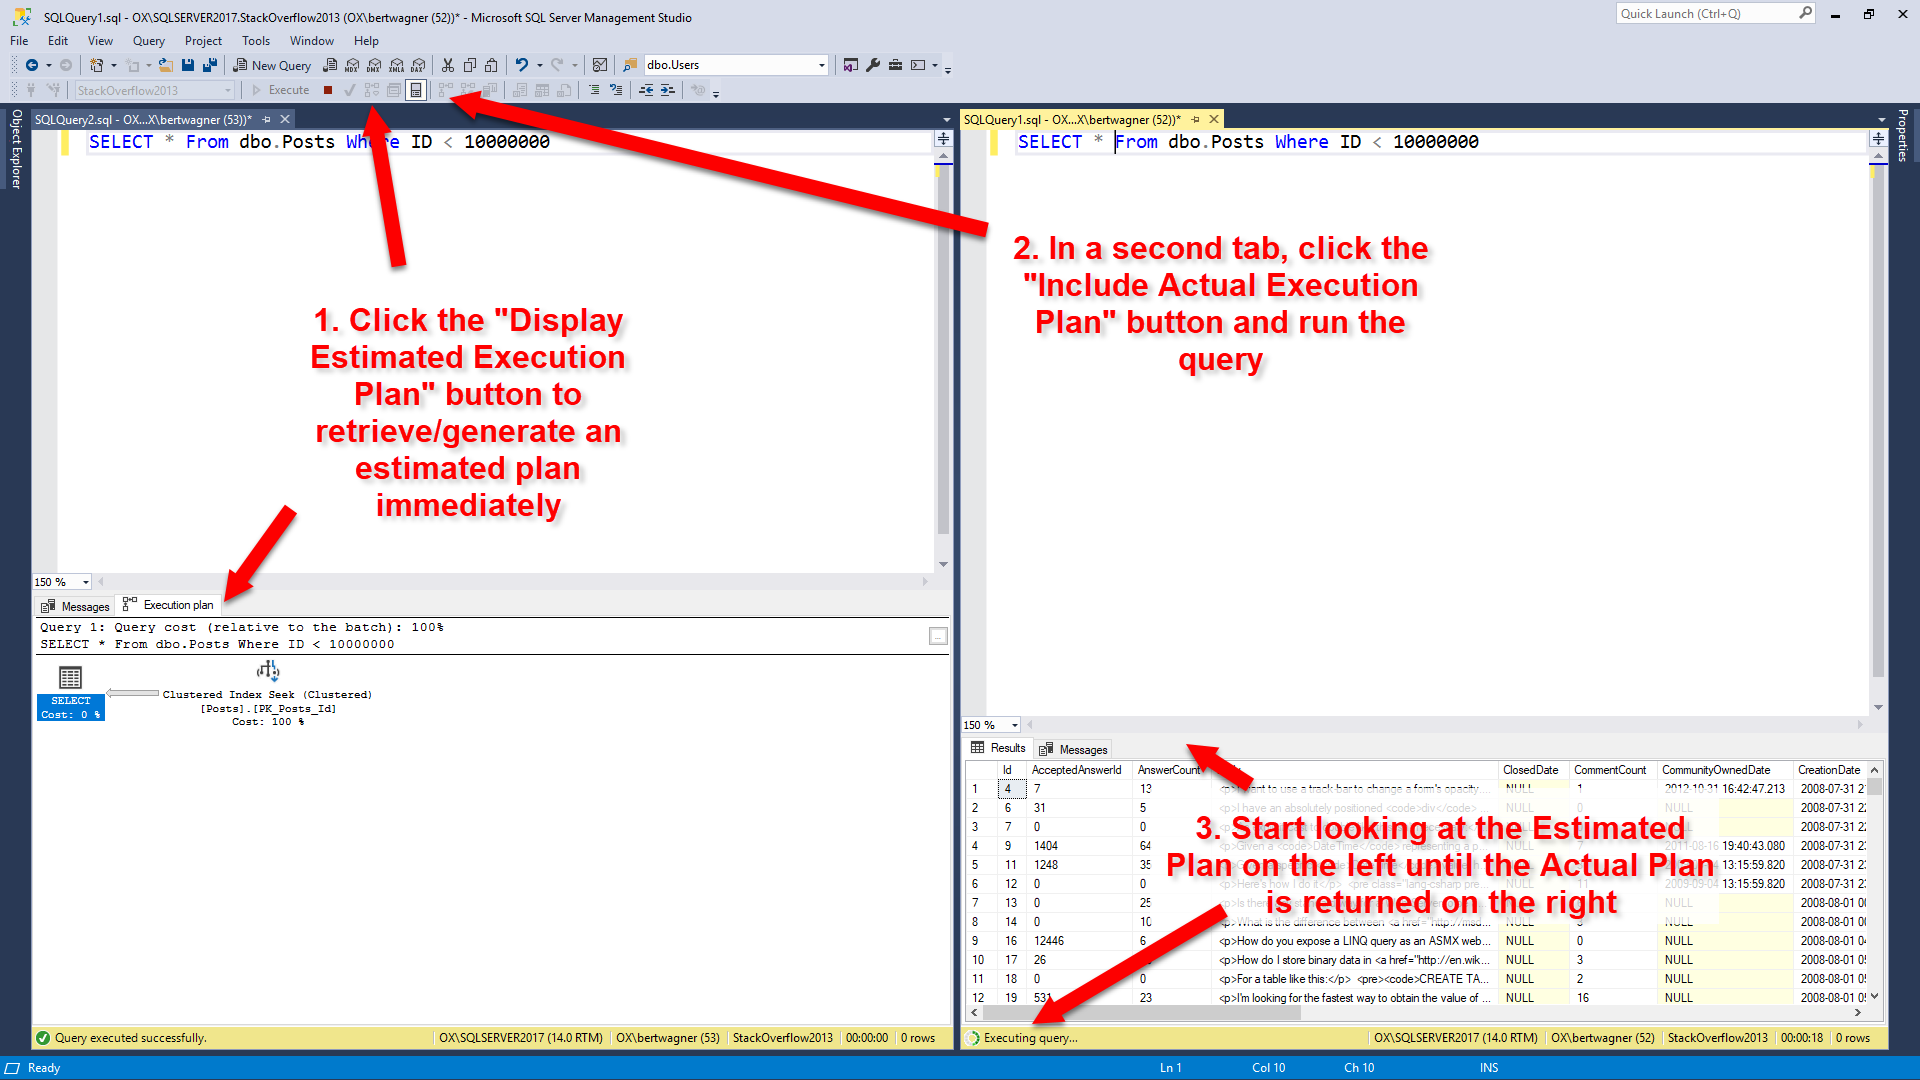
With the query pasted and formatted in my SSMS editor window, I like retrieving the estimated execution plan first, and then pasting the query into a second editor window and executing the query with the "Include Actual Execution Plan" option turned on. For bonus points, I'll split the SSMS window vertically so I can start looking at the estimated execution plan while the query runs and returns the actual execution plan: I like this combination because I (almost) immediately receive my estimated execution plan and can start looking for problems. Once the query on the right finishes executing and I get the actual plan with all of its lovely run-time stats, I usually switch to that looking at that one.

Some people take the opposite approach, looking at a cached query plan first before running the query to get a plan. This is fine too, but from my experience running the query first gives me some other data points to work with: is this query still running slowly, or was it a temporary issue? Did the person I'm reviewing the query for make some mistake and saw poor performance for some other unrelated reason? Getting the execution plan myself will help answer some of these questions.

livequerystatistics

But flaws exist with my process too. For example, running the query in an SSMS window may generate a new plan instead of reusing a cached plan (if something like white space is different between the two query texts). This is one of those things that is fine as long as you remember that's what could be happening. It even acts as a benefit because if you do get different query plans between your run and what exists in cache, then you know you might have a parameter sniffing problem. Finally, if the actual execution plan is impractical to retrieve (the query takes too long to run), then I will turn on Live Query Statistics: I don't start with this option because most queries I deal with will return by the time I finish looking over the estimated execution plan (and at that point the additional overhead of Live Query Statistics isn't worth it). But if I don't have time to wait for the actual plan to return, switching to Live Query Statistics and watching the long running query execute in real time will usually help diagnose the performance issue.

Unexpected Seeks vs Scans

Once I am viewing one of the execution plans above, one of the first things I check is where my data is being retrieved from.

If I see data coming primarily coming from nonclustered indexes, I feel pretty good that the data is being retrieved efficiently since only a limited number of columns are being returned and hopefully they are coming back in a beneficial sort order (this is going on the assumption that I keep my indexes pretty narrow to begin with).

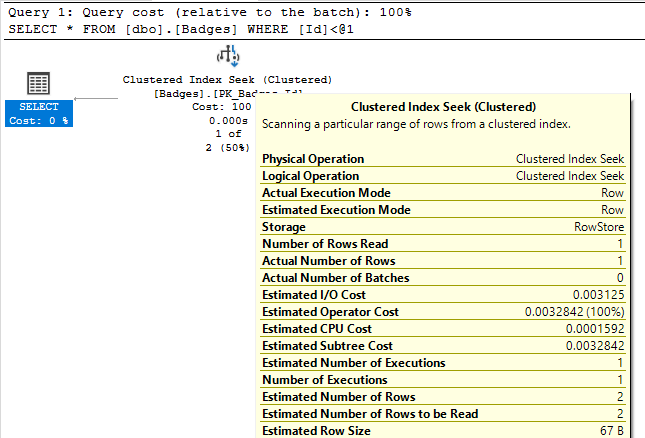
If all I see are index scans, that may be fine, but I want to make sure:

  1. I am not seeing table scans - at the very least they should be clustered index scans,
  2. I am not using an unnecessary
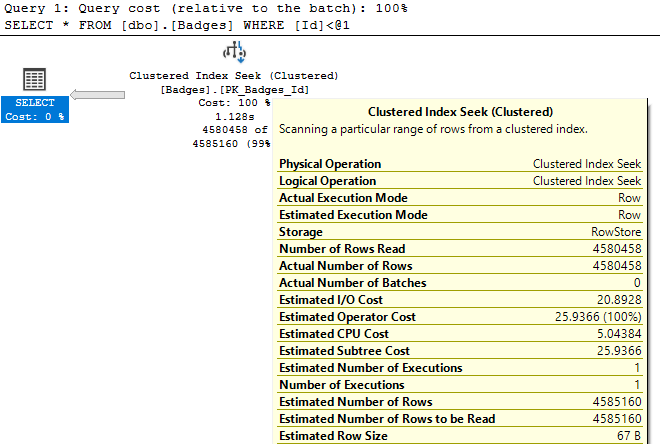
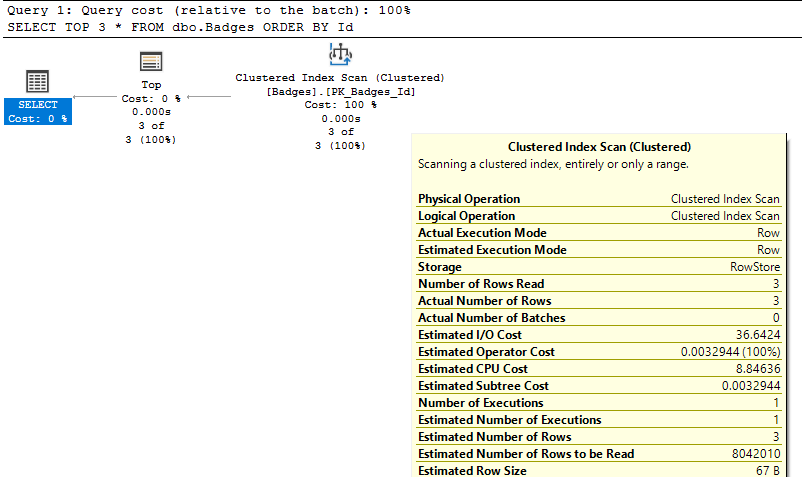
 SELECT * in my query - why read in all of that extra data into memory or prevent a narrower index usage if I don't need it,
  3. SQL Server isn't scanning an entire index to return only a limit subset of rows

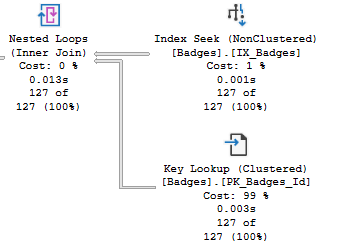
Finally, I like to double check any index seeks I see as part of key lookups. Once again, key lookups are not necessarily bad, but if I can include just one more column into a nonclustered index and get rid of the lookup, I may consider doing so if that part of the plan seems to be a bottleneck.

Inaccurate Row Estimates

Next I start looking at costly operators and checking their Actual Number of Rows vs Estimated Number of Rows values (for queries that don't return quickly, Live Query Statistics helps identify these easily). I may also look at the relative size of arrows to see if it looks like one operator is returning or reading significantly more rows than I would expect.

If Actual vs Estimated Number of Rows are vastly different (generally, if Actual is greater than Estimated by more than 100x), I start thinking about why SQL Server might be estimating the wrong number of rows by using common sense or looking at the statistics being used.

At this point I also consider whether the query is parameterized (either explicitly in the query or automatically by SQL Server). If it is, I usually start going down the path of checking for parameter sniffing.

Suspicious Operators

Next I look for any other commonly problematic operators in my plan: things like sorts, spools, hash joins, etc…

I've already covered these in a previous post of my Execution Plans series, but it's worth restating that I'm always keeping a look out for these operators.

Warnings

Finally, I quickly scan the plan for any yellow exclamation points present on any of the plan operators. These symbols indicate activities that SQL Server thinks it should warn us about. I also covered these in more detail in part 3, but it's worth mentioning again here because looking for these warnings can be a huge help in identifying the troublesome parts of your execution plan.

Conclusion

There is no one right way to troubleshoot or performance tune a query. I use the above method because it makes sense for my world where most of the queries I performance tune are my own and I have a pretty good knowledge of what other types of queries are running on my database. I hope sharing this process can help you develop your own preferred process for query tuning in your own environment.

SQL Server Execution Plan Operators

Watch this week's video on YouTube

When examining a query's execution plan, certain operators tend to crop up over and over again as the culprits of many performance problems.

Today I want to share which execution plan operators I typically look at first when checking for performance issues. While seeing these operators in your plans isn't necessarily a bad thing, they are always worth a double check to see if they are the cause of your query performance bottlenecks.

This is part 4 of a series on execution plans. Need to catch up? Check out part 1's introduction to execution planspart 2's overview of statistics, and part 3's explanation of how to read an execution plan.

Index Seek and Index Scan

Some of the first execution plan operators that many people learn to look for are clustered and non-clustered index seeks and scans. General wisdom says that seeks are good for performance because they represent SQL Server navigating directly to the rows of data it needs, while scans are bad because they represent SQL Server reading down the index to extract many rows, leading to a slower operation.

In general, this is a pretty good generalization. However, it's often important to check what your seek and scan operators are doing because it might not always be what you expect.

2019-08-12-20-24-03

For example, look at the Actual Number of Rows property for these two index seek operations: 

2019-08-12-20-25-01

In the first result set, we see the index seek returns 1 row based on our query's WHERE clause. This is the kind of performance we like to see! In the second query however, SQL Server "seeks" 4 million rows. While having an index seek return 4 million rows isn't necessarily a bad thing if that's what we actually need the query to do, it does show that not all seek operations are highly targeted, fast retrievals that you might expect when seeing the index seek operator.

And seeing an index scan doesn't immediately mean bad performance either:

2019-08-12-20-25-30

In this case, the index scan only returns 3 records. You won't be able to get much better performance than what you already have, even if you try to refactor your query/indexes to get this to become an Index Seek operation.

RID Lookup and Key Lookup

Another duo of operators I look for when troubleshooting performance in query plans are the RID and Key Lookup operators.

RID Lookup is an easy fix - if you see this operator, it means you are missing a clustered index on your table. At the very least you should add a clustered index and immediately get some improved performance for most if not all of your queries.

Key lookups are more nuanced. SQL Server uses a Key Lookup when it knows it can use a nonclustered index to retrieve data efficiently, but then has to go out to the clustered index to look up the remaining values for the rows that weren't present in the nonclustered index.

2019-08-12-20-27-27

Key lookups aren't necessarily always bad. Having SQL Server go out to the clustered index to retrieve the missing values it needs is pretty efficient compared to having to create and maintain whole new indexes.

However, if all SQL Server is retrieving from the Key Lookup operation is a single column of data, it might be just as easy to add that one column to your existing nonclustered index. Yes, the index size will be bigger by that one column, but if SQL Server can avoid having to go to two indexes to return all the data it needs, it will probably be more efficient overall.

Sort

2019-08-12-20-27-56

Sort operators are simple in what they do: they change the order of the rows of data that are flowing through it.

Sorting is one of the most expensive operations that can occur in an execution plan though, so it is best to avoid them as much as possible.

One of the easiest ways to avoid a sort operator is to have the data stored in that pre-ordered format. This can be accomplished by creating an index with the key columns listed in the same order as what the sort operator is doing.

If SQL Server is having to sort the same data in the same order multiple times as part of your execution plan, another possibility is to break the query up into multiple steps with indexed temporary tables used to stage the data in between each step. While replacing a single sort operator with an indexed temp table won't benefit performance, if you can reuse that temporary table multiple times as part of your query execution then you will obtain a net performance savings.

Spools

2019-08-12-20-29-45

Spools come in a variety of types, but most of them can be summarized as operators that store an intermediary result table in tempdb.

SQL Server often uses spools to process complex queries, transforming the data into a tempdb worktable to allow further data operations. The downside to this however is the need to write the data to disk in tempdb.

When I see a spool, I first often try to think if there is a way to rewrite the query to avoid the spool in the first place. If that fails, using the divide and conquer temp table technique can also replace a spool, giving you more control over how SQL Server is writing and indexing the data in tempdb.

Joins

2019-08-12-20-21-09

I've written about nested loops joinsmerge joins, and hash match joins before, but it's worth mentioning them in this post as well.

Merge joins are interesting to spot because of how rarely I see them in real-world queries; they cause celebration instead of concern however because they typically are the most efficient of the logical join operators.

Nested loops joins on the other hand I see often. I don't usually focus on these too much unless something else seems suspicious in the area surrounding them. Nested loops joins do a pretty good job of efficiently joining relatively small sets of data.

Hash match joins I almost always inspect closer. These join operators are typically chosen by the query optimizer for one of two reasons:

  1. The datasets being joined are so large that they can only be handled by a hash match join.
  2. The datasets are not ordered on their join columns and SQL Server thinks calculating hashes and looping through will be faster than sorting the data.

For the first scenario, there is not much you can do besides figuring out a way to join less data.

The second scenario is worth looking at a little more closely. If there is some way to get the data in ordered before joining, like predefining the sort order in an index, then it's possible SQL Server will choose a faster join algorithm instead.

Parallelism

Parallelism operators are typically viewed as good things: SQL Server chunks your data into multiple parts to be processed asynchronously on multiple CPUs, reducing the total wall clock time that it takes for your query to finish.

2019-08-12-20-30-36-1

However, parallelism can be a bad thing if ALL (or most) queries utilize parallelism. Parallelism isn't magic, the CPUs are still doing the same amount of work (and taking away resources from other queries that could be running), plus the overhead that you have to account for of SQL Server dividing up and then rejoining all of the data from multiple CPU threads.

I typically become suspicious of parallelism if it seems like most queries I troubleshoot on a server are producing parallel plans. If that's the case, I may consider revisiting the cost threshold for parallelism setting to see if it is set too low.

More operators

This post is not a definitive list of all execution plan operators; I tried to cover the ones I see causing me problems the most often.

If you are interested in learning about more operators, you can visit the official documentation or Hugo's wonderful SQL Server Execution Plan Reference's Operator List.