SQL Server Execution Plan Operators

Watch this week's video on YouTube

When examining a query's execution plan, certain operators tend to crop up over and over again as the culprits of many performance problems.

Today I want to share which execution plan operators I typically look at first when checking for performance issues. While seeing these operators in your plans isn't necessarily a bad thing, they are always worth a double check to see if they are the cause of your query performance bottlenecks.

This is part 4 of a series on execution plans. Need to catch up? Check out part 1's introduction to execution planspart 2's overview of statistics, and part 3's explanation of how to read an execution plan.

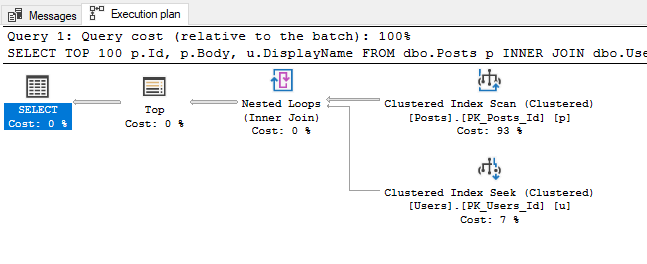
Index Seek and Index Scan

Some of the first execution plan operators that many people learn to look for are clustered and non-clustered index seeks and scans. General wisdom says that seeks are good for performance because they represent SQL Server navigating directly to the rows of data it needs, while scans are bad because they represent SQL Server reading down the index to extract many rows, leading to a slower operation.

In general, this is a pretty good generalization. However, it's often important to check what your seek and scan operators are doing because it might not always be what you expect.

2019-08-12-20-24-03

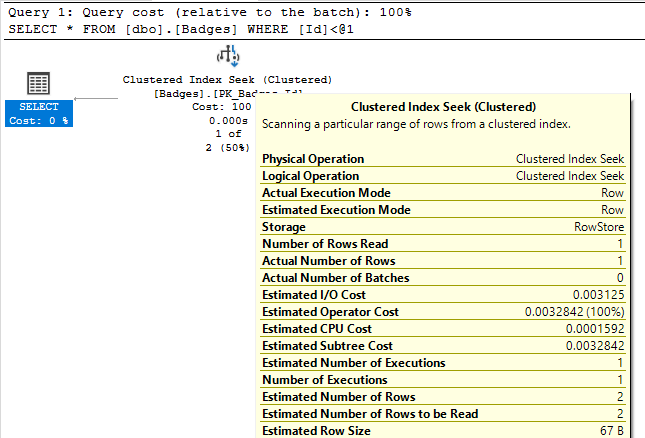
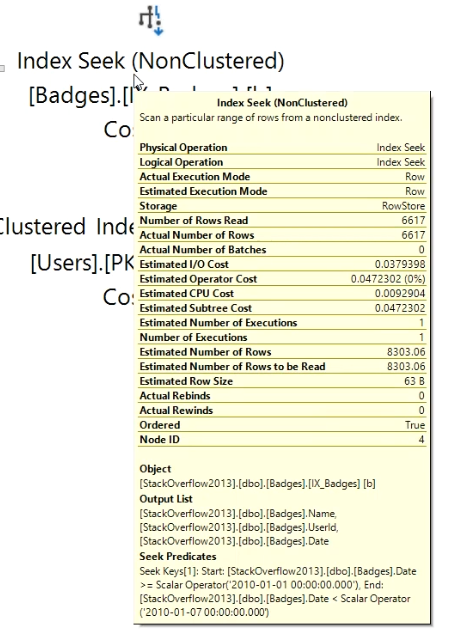
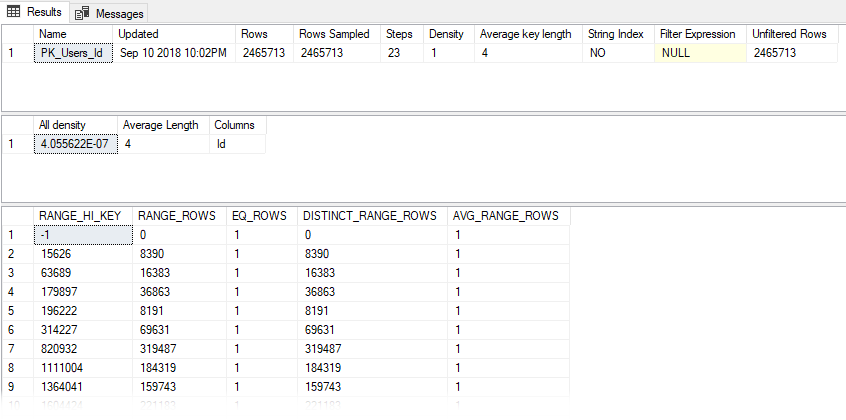
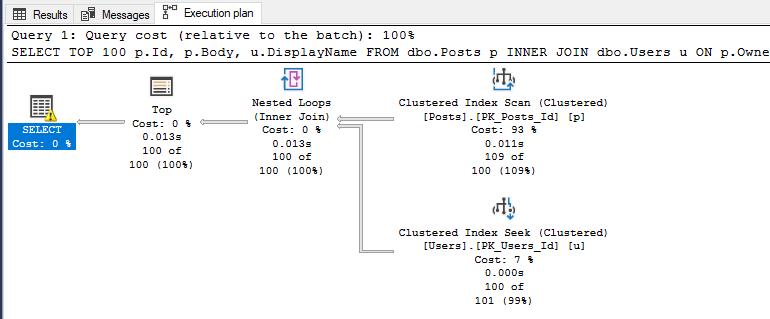
For example, look at the Actual Number of Rows property for these two index seek operations: 

2019-08-12-20-25-01

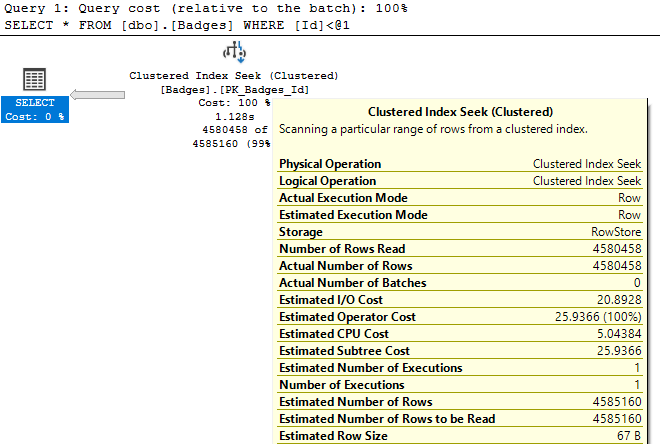
In the first result set, we see the index seek returns 1 row based on our query's WHERE clause. This is the kind of performance we like to see! In the second query however, SQL Server "seeks" 4 million rows. While having an index seek return 4 million rows isn't necessarily a bad thing if that's what we actually need the query to do, it does show that not all seek operations are highly targeted, fast retrievals that you might expect when seeing the index seek operator.

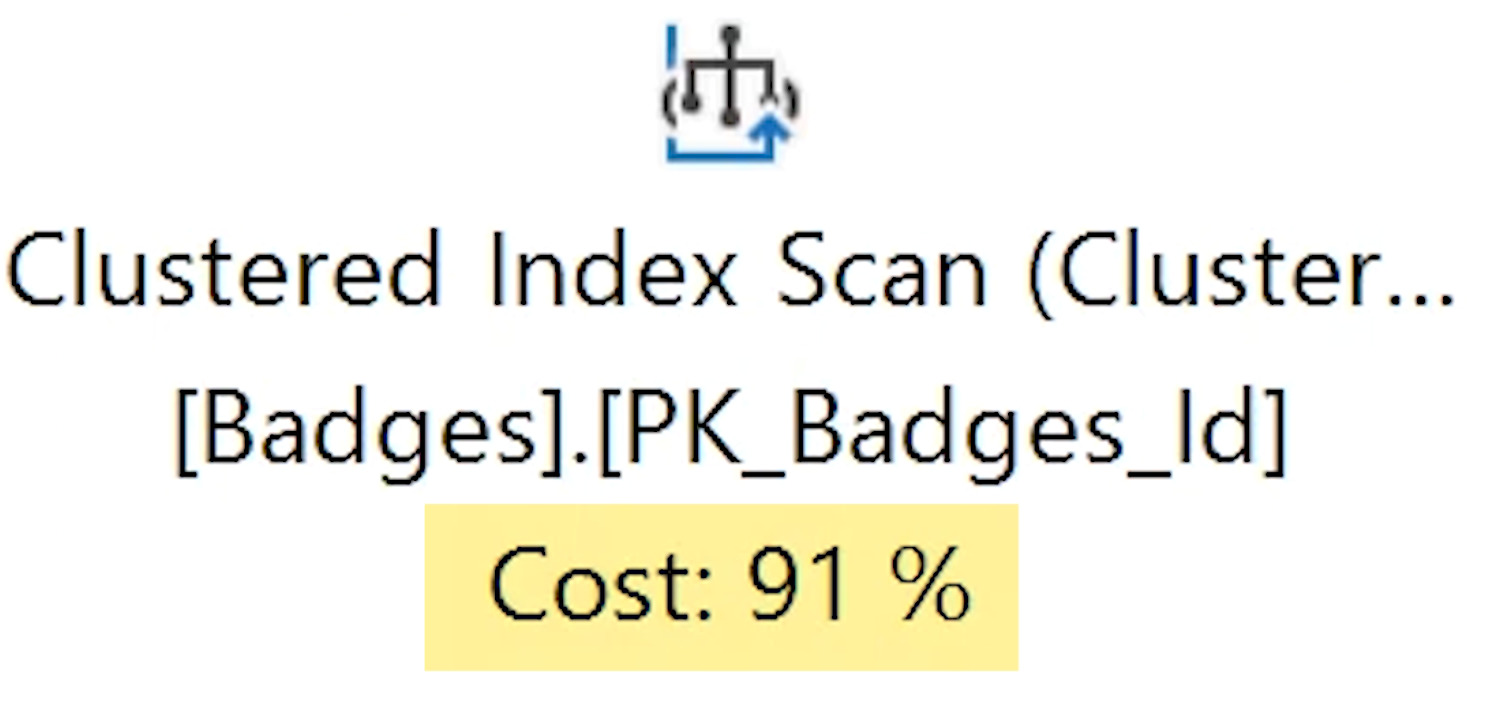
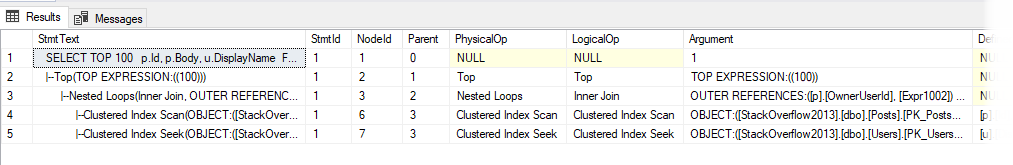
And seeing an index scan doesn't immediately mean bad performance either:

2019-08-12-20-25-30

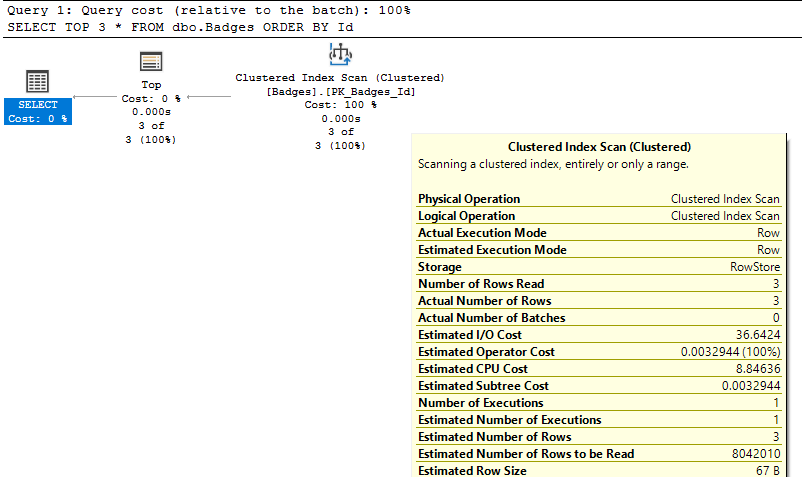
In this case, the index scan only returns 3 records. You won't be able to get much better performance than what you already have, even if you try to refactor your query/indexes to get this to become an Index Seek operation.

RID Lookup and Key Lookup

Another duo of operators I look for when troubleshooting performance in query plans are the RID and Key Lookup operators.

RID Lookup is an easy fix - if you see this operator, it means you are missing a clustered index on your table. At the very least you should add a clustered index and immediately get some improved performance for most if not all of your queries.

Key lookups are more nuanced. SQL Server uses a Key Lookup when it knows it can use a nonclustered index to retrieve data efficiently, but then has to go out to the clustered index to look up the remaining values for the rows that weren't present in the nonclustered index.

2019-08-12-20-27-27

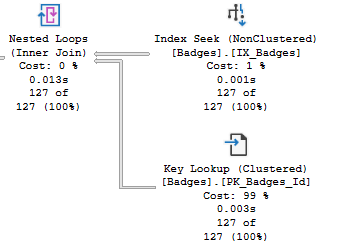
Key lookups aren't necessarily always bad. Having SQL Server go out to the clustered index to retrieve the missing values it needs is pretty efficient compared to having to create and maintain whole new indexes.

However, if all SQL Server is retrieving from the Key Lookup operation is a single column of data, it might be just as easy to add that one column to your existing nonclustered index. Yes, the index size will be bigger by that one column, but if SQL Server can avoid having to go to two indexes to return all the data it needs, it will probably be more efficient overall.

Sort

2019-08-12-20-27-56

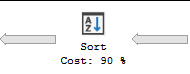
Sort operators are simple in what they do: they change the order of the rows of data that are flowing through it.

Sorting is one of the most expensive operations that can occur in an execution plan though, so it is best to avoid them as much as possible.

One of the easiest ways to avoid a sort operator is to have the data stored in that pre-ordered format. This can be accomplished by creating an index with the key columns listed in the same order as what the sort operator is doing.

If SQL Server is having to sort the same data in the same order multiple times as part of your execution plan, another possibility is to break the query up into multiple steps with indexed temporary tables used to stage the data in between each step. While replacing a single sort operator with an indexed temp table won't benefit performance, if you can reuse that temporary table multiple times as part of your query execution then you will obtain a net performance savings.

Spools

2019-08-12-20-29-45

Spools come in a variety of types, but most of them can be summarized as operators that store an intermediary result table in tempdb.

SQL Server often uses spools to process complex queries, transforming the data into a tempdb worktable to allow further data operations. The downside to this however is the need to write the data to disk in tempdb.

When I see a spool, I first often try to think if there is a way to rewrite the query to avoid the spool in the first place. If that fails, using the divide and conquer temp table technique can also replace a spool, giving you more control over how SQL Server is writing and indexing the data in tempdb.
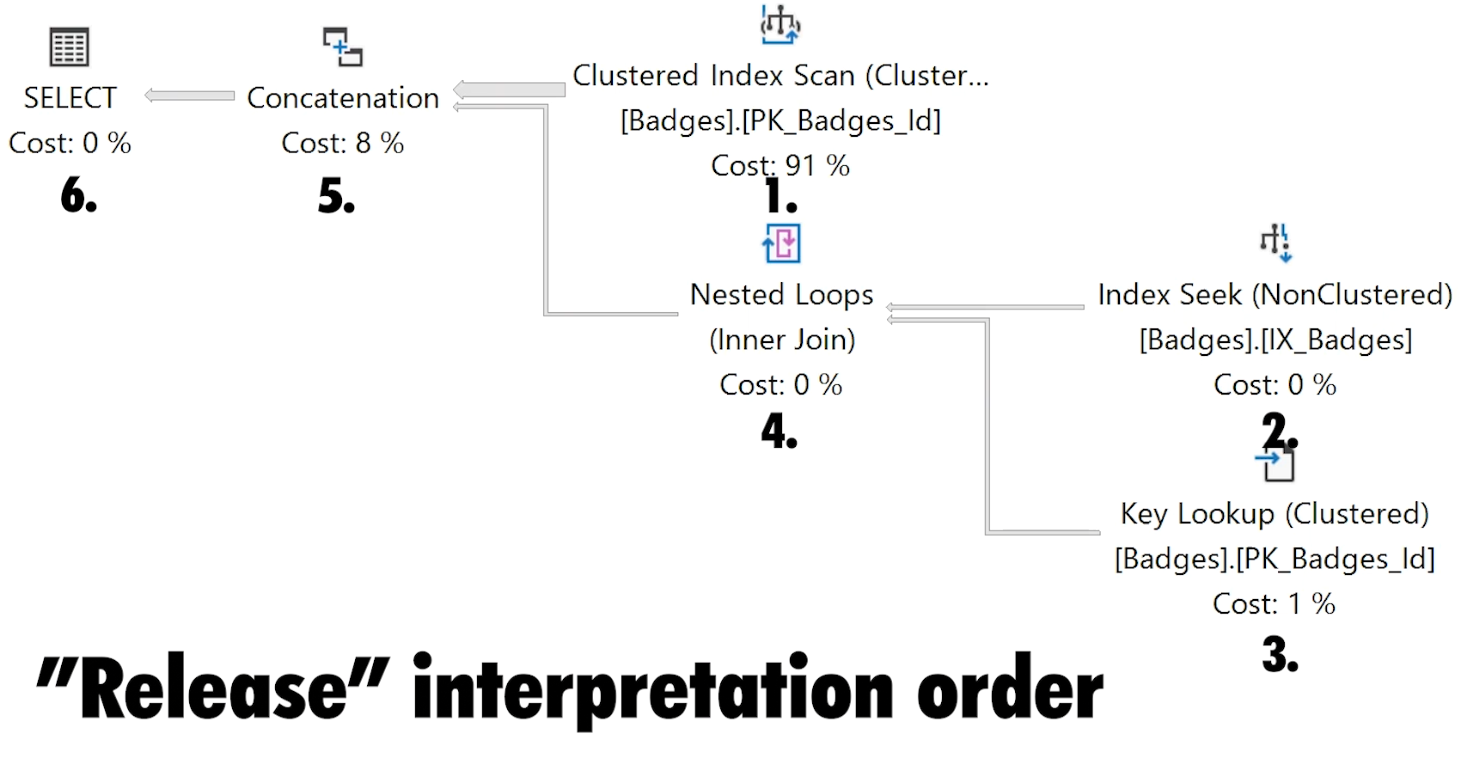
Joins

2019-08-12-20-21-09

I've written about nested loops joinsmerge joins, and hash match joins before, but it's worth mentioning them in this post as well.

Merge joins are interesting to spot because of how rarely I see them in real-world queries; they cause celebration instead of concern however because they typically are the most efficient of the logical join operators.

Nested loops joins on the other hand I see often. I don't usually focus on these too much unless something else seems suspicious in the area surrounding them. Nested loops joins do a pretty good job of efficiently joining relatively small sets of data.

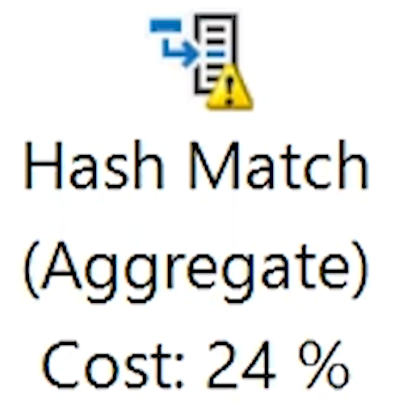
Hash match joins I almost always inspect closer. These join operators are typically chosen by the query optimizer for one of two reasons:

  1. The datasets being joined are so large that they can only be handled by a hash match join.
  2. The datasets are not ordered on their join columns and SQL Server thinks calculating hashes and looping through will be faster than sorting the data.

For the first scenario, there is not much you can do besides figuring out a way to join less data.

The second scenario is worth looking at a little more closely. If there is some way to get the data in ordered before joining, like predefining the sort order in an index, then it's possible SQL Server will choose a faster join algorithm instead.
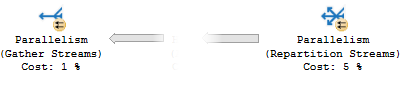
Parallelism

Parallelism operators are typically viewed as good things: SQL Server chunks your data into multiple parts to be processed asynchronously on multiple CPUs, reducing the total wall clock time that it takes for your query to finish.

2019-08-12-20-30-36-1

However, parallelism can be a bad thing if ALL (or most) queries utilize parallelism. Parallelism isn't magic, the CPUs are still doing the same amount of work (and taking away resources from other queries that could be running), plus the overhead that you have to account for of SQL Server dividing up and then rejoining all of the data from multiple CPU threads.

I typically become suspicious of parallelism if it seems like most queries I troubleshoot on a server are producing parallel plans. If that's the case, I may consider revisiting the cost threshold for parallelism setting to see if it is set too low.

More operators

This post is not a definitive list of all execution plan operators; I tried to cover the ones I see causing me problems the most often.

If you are interested in learning about more operators, you can visit the official documentation or Hugo's wonderful SQL Server Execution Plan Reference's Operator List.

5 Things You Need To Know When Reading SQL Server Execution Plans

Watch this week's video on YouTube

In the first part of this series I explained what an execution plan is and how to view one. Last week I threw you a curve ball and didn't show you any execution plans at all, instead focusing on the statistics data that helps SQL Server generate query plans. This week, we'll finally dive into what you need to know to read an execution plan.

Execution Plan Order

Execution plans show the steps SQL Server takes to execute your query. Each icon in the graphical execution plan is known as an operator, and the most common way to read a plan is by starting with the top right most operator and following the arrows to the left.

When you reach a join or concatenation operator where multiple branches merge into one operator, you can proceed to the right-most operator of one of the lower branches and start the process of reading right to left again. In general, this can be summed up as reading a plan right to left, top to bottom.

2019-08-05-21-16-50

By following the arrows from one operator to the next, you are following the flow of data through the plan. Each operator releases a row of data to the operator immediately to the left of it until all of the data rows have made their way to the left most operator.

Arrows

Arrows identify the direction of data flow between operators.

2019-08-05-21-20-20

In a SQL Server Management Studio execution plan, they also represent the relative size of the data at that step. Brent Ozar recently wrote a detailed post demoing the differences between arrow sizes between estimated and actual execution plans. In summary, the arrow size represents the estimated number of rows output from the source operator in estimated execution plans, and the number of rows read by the source operator in actual execution plans.

When troubleshooting plans, these relative arrow sizes can be helpful to tip you off of where you might be seeing more data than you expected in your plans.

Operator properties

Hovering over an operator (or an arrow) gives us additional information about what that operator is doing. Not only does the hover overlay provide a description of an operator, it also shows us the number of rows SQL Server expected to read during this step versus what it actually read (if using the actual execution plan), what predicates were applied, warning messages, and more.

2019-08-05-21-22-46

Bringing up the properties window (F4 by default) with an operator selected will provide even more information. I typically find myself looking in these properties to discover memory and CPU thread usage, and what transformations SQL Server is doing as part of my query execution.

Costs

2019-08-05-21-24-15

Under each operator you will notice the percentage cost of that operator relative to all other costs in the plan. These relative costs can sometimes help highlight where the major pain points in your execution plan are occurring.

I say sometimes because these execution plan costs are known to not always be accurate. Starting off your query performance troubleshooting session by identifying the high cost operators can be a good starting point, but you never want to rely on these cost numbers alone.

Warnings

2019-08-05-21-27-03

Warnings, denoted by a yellow exclamation point icon on the corner of the operator icon, indicate that something undesirable may be happening with that operator.

The usual culprits for these warnings are things are operators spilling to tempdb, implicit conversions that SQL Server has to make for a comparison (that potentially prevent an index from being used), and SQL Server telling you that it over/underestimated the amount of memory it needs to use for the query you are executing.

All of these problems might negatively impact query performance so it's always worth taking a look at the warning to see if it is important enough to correct.

Index Recommendations

2019-08-05-21-30-00

If SQL Server thinks your query's performance can be improved with an index, it will tell you in reassuring green text at the top of your execution plan. How helpful!

The only catch is that these index recommendations usually aren't ready to use. It's not that they are bad, it's just that they are often incomplete, missing additional columns you could include to make your queries even more efficient than what the base recommendation suggests.

So while these recommendations are a good starting point, you should always give them some additional attention to see if you can improve them further.

Execution Plans: Statistics

Watch this week's video on YouTube

Last week we looked at what execution plans are and how you can view them.

This week I want to discuss what data the query optimizer uses to make cost-based calculations when generating execution plans. Understanding the meta-data SQL Server uses to generate query plans will later help us correct poorly performing queries.

Statistics

Statistics are the primary meta data used by the query optimizer to help estimate the costs of retrieving data for a specific query plan.

The reason SQL Server uses statistics is to avoid having to calculate information about the data during query plan generation. For example, you don't want to have the optimizer scan a billion row table to learn information about it, only to then scan it again when executing the actual query.

Instead, it's preferable to have those summary statistics pre-calculated ahead of time. This allows the query optimizer to quickly generate and compare multiple candidate plans before choosing one to actually execute.

Creating and Viewing Statistics

Statistics are automatically maintained when the Auto Create Statistics and Auto Update Statistics database properties are on (in general, you want to leave these on):

2019-07-29-20-31-36

Now, anytime an index is created or enough data in that index has changed (see thresholds for the amount of data in the SQL Server documentation), the statistics information will be updated and maintained as well.

To view the statistics for an index or column, you can run DBCC SHOW_STATISTICS:

DBCC SHOW_STATISTICS('dbo.Users','PK_Users_Id')

2019-07-29-20-32-58

Statistics Data

The data returned by DBCC SHOW_STATISTICS is what SQL Server uses to interpret what the data in your index looks like.

I don't to turn this into a deep dive on statistics , but here are a few key things you should be aware of in this statistics output: - Rows: the number of rows in the table. - Rows Sampled: how many rows were used to calculate these statistics. This can be a subset or all of the rows of your table. - All Density: a measure of how many distinct values are in your data. - Histogram: shows frequencies for up to 200 ranges of values in your index.

Altogether, this information helps paint a picture of your data for the SQL Server query optimizer to use for deciding how it should retrieve your data.

When this picture is accurate, the query optimizer makes decisions that allow your queries execute relatively efficiently. If it has correct estimates about the number of rows it needs to process and the uniqueness of values within those rows, then the query optimizer will most likely allocate appropriate amounts of memory, choose efficient join algorithms, and make other performance choices that will make your query run efficiently.

When the statistics don't accurately represent the data, the query optimizer still tries to do the best with the information it has available but often ends up making some less-than-optimal choices.

We'll save troubleshooting statistics information for another post, but for now be aware that if your statistics are inaccurate, there is a pretty good change SQL Server won't generate efficient execution plans.

Cardinality Estimators

Having high level statistics about your data is only the first part of the equation. SQL Server needs to use those statistics alongside some assumptions to estimate how expensive it will be to retrieve that data.

The assumptions SQL Server makes about data are contained within the Cardinality Estimator. The Cardinality Estimator is a model that makes assumptions about things like data correlation, distribution, and more.

There are two cardinality estimating models currently available in SQL Server: the Legacy Cardinality Estimator available from SQL Server 7.0 to SQL Server 2012, and the New Cardinality Estimator introduced in SQL Server 2014. Each of these Cardinality Estimators makes different assumptions about your data and can therefore produce different results. General guidance suggests to use the New Cardinality Estimator for new work, however sometimes it can be beneficial to use the Legacy Cardinality Estimator if its assumptions more closely align with your data.

Once again, I don't want to go too deep on the differences between cardinality estimators, but it's worth knowing that if you are getting bad estimates from the New Cardinality Estimator, you can easily revert to the Legacy Cardinality Estimator by appending the following hint to the end of your query:

OPTION (USE HINT ('FORCE_LEGACY_CARDINALITY_ESTIMATION'));  

Conclusion

SQL Server pre-calculates statistics data on indexes and columns to provide the Query Optimizer information about the data it needs to retrieve. When these statistics accurately reflect what the data actually looks like, SQL Server will typically generate execution plans that perform well. When this data is outdated or missing, SQL Server makes an uninformed guess about how to retrieve the data, potentially causing serious performance issues.

Introduction to SQL Server Execution Plans

Watch this week's video on YouTube

I nearly always use execution plans as the starting point for SQL query performance troubleshooting. In this multi-part series, I plan to review the basics of execution plans and how you can use them to improve the performance of your own queries.

Execution Plans

SQL is a declarative language: instead of programming the details of how data should be retrieved, we describe what data we want and SQL Server figures out how it should return it to us.

For most queries that we want to performance tune, the SQL Server Query Optimizer considers multiple options for returning the data. It estimates the costs of these various approaches and lands on one that it thinks will return the data in an efficient manner. All of these options for retrieving the data are what are known as query execution plans.

Most of the time, this process works well and the Query Optimizer ends up choosing a query plan that returns the requested data quickly. This however does not mean that SQL Server chooses the "most efficient" query plan. Besides debating what "most efficient" means in different scenarios, SQL Server doesn't want to spend hours calculating every possible way to return your data when it only takes a fraction of that time to find a plan that is "good enough".

Problems arise when the Query Optimizer selects a query plan that isn't very good at all. This can happen due to a number of issues that we'll look at in future parts of this series.

Today we'll focus on learning how we can obtain execution plans for our queries.

Viewing Execution Plans

To see an execution plan for your query, you can run SET SHOWPLAN_ALL ON. This will provide a text-based tree representation of the plan:

SET SHOWPLAN_ALL ON
GO
--Query
GO
SET SHOWPLAN_ALL OFF
GO

2019-07-22-20-17-57

This may look familiar to you if you are used to looking at plans in other relational database environment that use similar tree-based plan explanations. In SSMS we have a a more visual option available to though. If we click the "Display Estimated Execution Plan" button or run SET SHOWPLAN_XML ON and execute our query, we will get our graphical execution plan:

2019-07-22-20-20-52

2019-07-22-20-21-45

This graphical representation is my personal preference (and what we will be mostly focusing on in this series) but it's important to know that as hinted by the last command, you can also right click on this graphical execution plan and choose "Show Execution Plan XML" to see the XML that is driving all of the visuals:

2019-07-22-20-22-31

2019-07-22-20-23-19

While most people don't find the XML as easy to digest as the graphical execution plan, it's worth knowing it is there: sometimes you will have to dive into the XML to find properties that don't get displayed in the graphical version.

Actual Plans

So far, every plan we've looked at is what's known as an "estimated" execution plan. The "estimated" name means it only contains "estimates" of how many rows will be processed based on internal meta data that SQL Server has available. You can view the "actual" execution plan by selecting the appropriate icon in SSMS:

2019-07-22-20-24-54

2019-07-22-20-25-19

There often confusion that occurs due to the naming of "estimated" vs "actual" execution plans. The difference is that the estimated plan is calculated before executing the SQL statement so it only has estimated meta data available for it to display, whereas the actual execution plan is that same estimated execution plan overlayed with runtime information like how many rows were processed, how much memory was used, etc…

Live Query Statistics

Live Query statistics give you the best of both estimated and actual execution plans. With Live Query Statistics enabled, SQL Server provides the estimated execution plan but overlays live runtime statistics on top of the plan as the query is executing in real-time.

2019-07-22-20-27-23

livequerystatistics

Live Query Statistics are nice because they allow you to often see "where" in the execution plan a query is experiencing a performance bottleneck. This is particularly helpful if you are new to analyzing execution plans and haven't yet learned all of the common signs and operators that might indicate poor performance. It is also helpful when your query is performing so poorly that you are unable to retrieve an actual plan for it (since it executes for what seems like forever).

Historical Plans

Calculating query plans isn't free, so SQL Server caches query plans for reuse. These cached plans can be viewed in the sys.dm_exec_query_plan DMV:

SELECT 
    *
FROM 
    sys.dm_exec_cached_plans      
    CROSS APPLY sys.dm_exec_query_plan(plan_handle)
    CROSS APPLY  sys.dm_exec_sql_text(plan_handle) 

2019-07-22-20-36-25

It's worth noting that this set of DMVs only show plans that are still in the cache and do not show actual plan statistics in them (plus some other limitations).

If you have Query Store enabled on your database, you can also access the query plans stored in the Query Store DMVs (or via the Query Store GUI):

SELECT 
    CAST(p.query_plan AS XML), 
    *
FROM 
    sys.query_store_query AS q
    INNER JOIN sys.query_store_plan AS p
        ON q.query_id = p.query_id

Conclusion

Regardless of how and where you decide to retrieve your execution plan from, all of the above techniques will help provide insight into how SQL Server is obtaining the data that you specified in your query.

12 Ways To Rewrite SQL Queries for Better Performance

Watch this week's video on YouTube

Over the past several week's I've been exploring ways to rewrite queries to improve execution performance.

I learned a lot of these techniques over time from trial an error, attending presentations, reading blog posts, speaking to other dbas and developers, etc... but never knew of a good resource that summarized these techniques in one place.

This post will be a quick round-up of everything I've covered so far, as well as 8 additional techniques that I use occasionally but don't necessarily require a full detailed post to explain them.

Why Rewrite Queries?

I often find myself working in environments where modifying indexes or changing server settings is out of the question when performance tuning. I usually run into these scenarios when dealing with:

  • Vendor databases
  • "Fragile" systems
  • Not enough disk space
  • Limited tooling/ad hoc analysis
  • Features limited by security software

While solving the root cause of a performance problem is always preferable, sometimes the only way I'm able to fix problems in these environments is by rewriting the queries.

I decided to write this summary post because it is a resource I would have loved to have when starting out. Sometimes it can be easy to get "writer's block" when trying to think of ways to rewrite a SQL query, so hopefully this list of techniques can provide ideas and get your creative juices flowing.

So, without further ado, here is a list of 12 techniques in no particular order that you can use to rewrite your queries to change their performance.

12 Ways to Refactor a Query to Change Performance

1. Window functions vs GROUP BY

Sometimes window functions rely a little too much on tempdb and blocking operators to accomplish what you ask of them. While using them is always my first choice because of their simple syntax, if they perform poorly you can usually rewrite them as an old-fashioned GROUP BY to achieve better performance.

2. Correlated subqueries vs derived tables

Many people like using correlated subqueries because the logic is often easy to understand, however switching to derived table queries often produces better performance due to their set-based nature.

3. IN vs UNION ALL

When filtering rows of data on multiple values in tables with skewed distributions and non-covering indexes, writing your logic into multiple statements joined with UNION ALLs can sometimes generate more efficient execution plans than just using IN or ORs.

4. Temporary Staging Tables

Sometimes the query optimizer struggles to generate an efficient execution plan for complex queries. Breaking a complex query into multiple steps that utilize temporary staging tables can provide SQL Server with more information about your data. They also cause you to write simpler queries which can cause the optimizer to generate more efficient execution plans as well as allow it to reuse result sets more easily.

5. Forcing Table Join Orders

Sometimes outdated statistics and other insufficient information can cause the SQL Server query optimizer to join tables in a less than ideal sequence. Adam Machanic has a fantastic presentation on forcing table join order with blocking operators without having to resort to join hints.

6. DISTINCT with few unique values

Using the DISTINCT operator is not always the fastest way to return the unique values in a dataset. In particular, Paul White uses recursive CTEs to return distinct values on large datasets with relatively few unique values. This is a great example of solving a problem using a very creative solution.

7. Eliminate UDFs

UDFs often cause poor query performance due to forcing serial plans and causing inaccurate estimates. One way to possibly improve the performance of queries that call UDFs is to try and inline the UDF logic directly into the main query. With SQL Server 2019 this will be something that happens automatically in a lot of cases, but as Brent Ozar points out you might occasionally have to manually inline a UDF's functionality to get the best performance.

8. Create UDFs

Sometimes a poorly configured server will parallelize queries too frequently and cause poorer performance than their serially equivalent plan. In those cases, putting the troublesome query logic into a scalar or multi-statement table-valued function might improve performance since they will force that part of the plan to run serially. Definitely not a best practice, but it is one way to force serial plans when you can't change the cost threshold for parallelism.

9. Data Compression

Not only does data compression save space, but on certain workloads it can actually improve performance. Since compressed data can be stored in fewer pages, read disk speeds are improved, but maybe more importantly the compressed data allows more to be stored in SQL Server's buffer pool, increasing the potential for SQL Server to reuse data already in memory.

10. Indexed Views

When you can't add new indexes to existing tables, you might be able to get away with creating a view on those tables and indexing the view instead. This works great for vendor databases where you can't touch any of the existing objects.

11. Switch cardinality estimators

The newer cardinality estimator introduced in SQL Server 2014 improves the performance of many queries. However, in some specific cases it can make queries perform more slowly. In those cases, a simple query hint is all you need to force SQL Server to change back to the legacy cardinality estimator.

12. Copy the data

If you can't get better performance by rewriting a query, you can always copy the data you need to a new table in a location where you CAN create indexes and do whatever other helpful transformations you need to do ahead of time.

...And more

By no means is this list exhaustive. There are so many ways to rewrite queries, and not all of them will work all the time.

The key is to think about what the query optimizer knows about your data and why it's choosing the plan it is. Once you understand what it's doing, you can start getting creative with various query rewrites that address that issue.