Execution Plans: Statistics

Watch this week's video on YouTube

Last week we looked at what execution plans are and how you can view them.

This week I want to discuss what data the query optimizer uses to make cost-based calculations when generating execution plans. Understanding the meta-data SQL Server uses to generate query plans will later help us correct poorly performing queries.

Statistics

Statistics are the primary meta data used by the query optimizer to help estimate the costs of retrieving data for a specific query plan.

The reason SQL Server uses statistics is to avoid having to calculate information about the data during query plan generation. For example, you don't want to have the optimizer scan a billion row table to learn information about it, only to then scan it again when executing the actual query.

Instead, it's preferable to have those summary statistics pre-calculated ahead of time. This allows the query optimizer to quickly generate and compare multiple candidate plans before choosing one to actually execute.

Creating and Viewing Statistics

Statistics are automatically maintained when the Auto Create Statistics and Auto Update Statistics database properties are on (in general, you want to leave these on):

2019-07-29-20-31-36

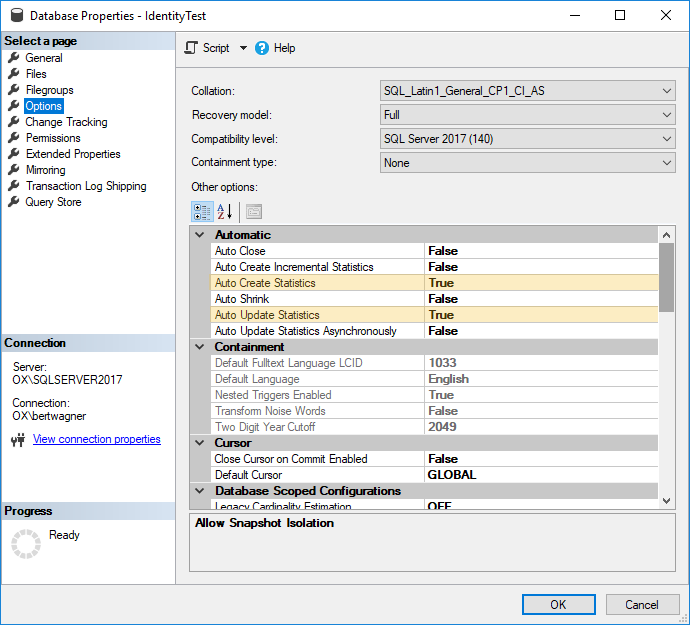
Now, anytime an index is created or enough data in that index has changed (see thresholds for the amount of data in the SQL Server documentation), the statistics information will be updated and maintained as well.

To view the statistics for an index or column, you can run DBCC SHOW_STATISTICS:

DBCC SHOW_STATISTICS('dbo.Users','PK_Users_Id')

2019-07-29-20-32-58

Statistics Data

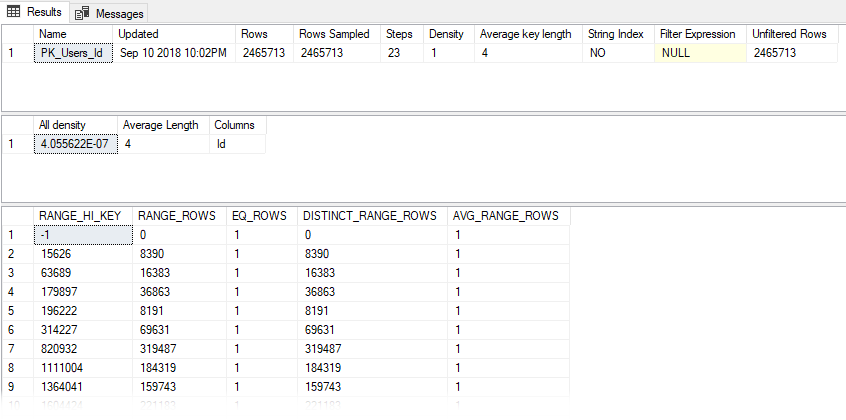
The data returned by DBCC SHOW_STATISTICS is what SQL Server uses to interpret what the data in your index looks like.

I don't to turn this into a deep dive on statistics , but here are a few key things you should be aware of in this statistics output: - Rows: the number of rows in the table. - Rows Sampled: how many rows were used to calculate these statistics. This can be a subset or all of the rows of your table. - All Density: a measure of how many distinct values are in your data. - Histogram: shows frequencies for up to 200 ranges of values in your index.

Altogether, this information helps paint a picture of your data for the SQL Server query optimizer to use for deciding how it should retrieve your data.

When this picture is accurate, the query optimizer makes decisions that allow your queries execute relatively efficiently. If it has correct estimates about the number of rows it needs to process and the uniqueness of values within those rows, then the query optimizer will most likely allocate appropriate amounts of memory, choose efficient join algorithms, and make other performance choices that will make your query run efficiently.

When the statistics don't accurately represent the data, the query optimizer still tries to do the best with the information it has available but often ends up making some less-than-optimal choices.

We'll save troubleshooting statistics information for another post, but for now be aware that if your statistics are inaccurate, there is a pretty good change SQL Server won't generate efficient execution plans.

Cardinality Estimators

Having high level statistics about your data is only the first part of the equation. SQL Server needs to use those statistics alongside some assumptions to estimate how expensive it will be to retrieve that data.

The assumptions SQL Server makes about data are contained within the Cardinality Estimator. The Cardinality Estimator is a model that makes assumptions about things like data correlation, distribution, and more.

There are two cardinality estimating models currently available in SQL Server: the Legacy Cardinality Estimator available from SQL Server 7.0 to SQL Server 2012, and the New Cardinality Estimator introduced in SQL Server 2014. Each of these Cardinality Estimators makes different assumptions about your data and can therefore produce different results. General guidance suggests to use the New Cardinality Estimator for new work, however sometimes it can be beneficial to use the Legacy Cardinality Estimator if its assumptions more closely align with your data.

Once again, I don't want to go too deep on the differences between cardinality estimators, but it's worth knowing that if you are getting bad estimates from the New Cardinality Estimator, you can easily revert to the Legacy Cardinality Estimator by appending the following hint to the end of your query:

OPTION (USE HINT ('FORCE_LEGACY_CARDINALITY_ESTIMATION'));  

Conclusion

SQL Server pre-calculates statistics data on indexes and columns to provide the Query Optimizer information about the data it needs to retrieve. When these statistics accurately reflect what the data actually looks like, SQL Server will typically generate execution plans that perform well. When this data is outdated or missing, SQL Server makes an uninformed guess about how to retrieve the data, potentially causing serious performance issues.

IN vs UNION ALL

Watch this week's video on YouTube

When you need to filter query results on multiple values, you probably use an IN() statement or multiple predicates separated by ORs:

WHERE Col1 IN ('A','B','C')

or

WHERE Col1 = 'A' OR Col1 = 'B' OR Col1 = 'C'

While SQL Server will generate the same query plan for either syntax, there is another technique you can try that can sometimes can improve performance under certain conditions: UNION ALL.

This post is a continuation of my series to document ways of refactoring queries for improved performance. I'll be using the StackOverflow 2014 data dump for these examples if you want to play along at home.

Lookups and Scans

Let's say we have the following index on our dbo.Badges table:

CREATE NONCLUSTERED INDEX [IX_Badges] ON [dbo].[Badges] ([Name]) INCLUDE ([UserId]);

Next let's run these two separate queries:

/* Query 1 */
SELECT 
    Name, UserId, Date 
FROM 
    dbo.Badges 
WHERE 
    Name = 'Benefactor'
OPTION(MAXDOP 1)

/* Query 2 */
SELECT 
    Name, UserId, Date 
FROM 
    dbo.Badges 
WHERE 
    Name = 'Research Assistant'
OPTION(MAXDOP 1)

Note I'm enforcing MAXDOP 1 here to remove any performance differences due to parallelism in these demos.

The nonclustered index doesn't cover these queries - while SQL Server can seek the index for the Name predicate in the WHERE clause, it can't retrieve all the columns in the SELECT from the index alone. This leaves SQL Server with a tough choice to make:

  1. Does it scan the whole clustered index to return all the required columns for the rows requested?
  2. Does it seek to the matching records in the nonclustered index and then perform a key lookup to retrieve the remaining data?

So, what does SQL Server decide to do?

2019-04-26-15-46-29

For Query 1, SQL Server thinks that reading the entire clustered index and returning only the rows where Name = 'Benefactor' is the best option.

SQL Server takes a different approach for Query 2 however, using the non-covering nonclustered indexes to find the records with Name = 'Research Assistant' and then going to look up the Date values in the clustered index via a Key Lookup

The reason SQL server chooses these two different plans is because it thinks it will be faster to return smaller number of records with a Seek + Key Lookup approach ("Research Assistant", 127 rows), but faster to return a larger number of records with a Scan ("Benefactor", 17935 rows).

Kimberly Tripp has an excellent post that defines where this "tipping point" from a key lookup to a clustered index scan typically occurs, but the important thing to keep in mind for this post is that we can sometimes use SQL Server's ability to switch between these two approaches to our advantage.

Combining Queries with IN

So, what plan does SQL Server generate when we combine our two queries into one?

SELECT 
    Name, UserId, Date 
FROM 
    dbo.Badges 
WHERE 
    Name IN ('Benefactor','Research Assistant')
OPTION(MAXDOP 1)

2019-04-25-21-39-29

Interestingly enough SQL Server decides to retrieve the requested rows from the nonclustered index and then go lookup the remaining Date column in the clustered index.

If we look at the page reads (SET STATISTICS IO ON;) we'll see SQL Server had to read 85500 pages to return the data requested:

(18062 rows affected)
Table 'Badges'. Scan count 2, logical reads 85500, physical reads 20, read-ahead reads 33103, ...

Without correcting our index to include the Date column, is there some way we can achieve the same results with better performance?

UNION ALL

In this case it's possible to rewrite our query logic to use UNION ALL instead of IN/ORs:

SELECT 
    Name,UserId,Date 
FROM 
    dbo.Badges 
WHERE 
    Name = 'Benefactor' 
UNION ALL
SELECT 
    Name,UserId,Date 
FROM 
    dbo.Badges 
WHERE 
    Name = 'Research Assistant'
OPTION(MAXDOP 1)

2019-04-25-21-40-09

We get the same exact results through a hybrid execution plan.

In this case, our plan mirrors what SQL Server did when running our original two queries separately:

  • The rows where Name = 'Benefactor' are returned by scanning the clustered index.
  • The nonclustered index is seeked with clustered index lookups for the Name = 'Research Assistant' records.

Looking at the IO statistics for this UNION ALL query:

(18062 rows affected)
Table 'Badges'. Scan count 2, logical reads 50120, physical reads 6, read-ahead reads 49649, ...

Even though this query reads the whole clustered index to get the Benefactor rows, the total number of logical reads is still smaller than the seek/key lookup pattern seen in the combined query with IN(). This UNION ALL version gives SQL Server the ability to build a hybrid execution plan, combining two different techniques to generate a plan with fewer overall reads.

IN or UNION ALL?

There's no way to know for sure without trying each variation.

But if you have a slow performing query that is filtering on multiple values within a column, it might be worth trying to get SQL Server to use a different plan by rewriting the query.

Correlated Subqueries vs Derived Tables

Watch this week's video on YouTube

Correlated subqueries provide an intuitive syntax for writing queries that return related data. However, they often perform poorly due to needing to execute once for every value they join on.

The good news is that many correlated subqueries can be rewritten to use a derived table for improved performance.

This post is a continuation of my series to document ways of refactoring queries for improved performance. I'll be using the StackOverflow 2014 data dump for these examples if you want to play along at home.

When was each user's first badge awarded?

StackOverflow awards users badges for things like asking good questions, hitting certain vote thresholds, and more.

I want to write a query that figures out on what date did each user receive their first badge.

Using a correlated subquery, I might write my query as follows:

SET STATISTICS IO, TIME ON;

SELECT DISTINCT
    UserId,
    FirstBadgeDate = (SELECT MIN(Date) FROM dbo.Badges i WHERE o.UserId = i.UserId)
FROM
    dbo.Badges o

The syntax of the correlated subquery here makes it clear that for each UserId we want to return the MIN(Date) associated with that UserId from the badges table.

Looking at the execution plan and time and IO statistics (abbreviated for clarity) we see:

2019-04-18-07-11-57

(1318413 rows affected)
Table 'Worktable'. Scan count 0, logical reads 0, ...
Table 'Workfile'. Scan count 0, logical reads 0, ...
Table 'Badges'. Scan count 2, logical reads 43862, ...

(1 row affected)

 SQL Server Execution Times:
   CPU time = 3625 ms,  elapsed time = 8347 ms.

So, what's going on here? We read ~8 million rows of data from our index on the dbo.Badges table and then calculate the MIN(Date) for each UserId. This is the "correlated" part of our query, which then gets joined back to the dbo.Badges table using a Hash Match join operator.

Our join doesn't eliminate any rows so the ~8 million rows continue flowing through until near the very end where we have another Hash Match operator, this time being used to dedupe the rows for the DISTINCT part of query, reducing the final result to ~1 million rows.

Eliminating the Correlated Subquery

What would things look like if we rewrote this correlated subquery as a derived table in the FROM clause?

SELECT DISTINCT
    o.UserId,
    FirstBadgeDate
FROM
    dbo.Badges o
    INNER JOIN 
        (SELECT 
            UserId, 
            MIN(Date) as FirstBadgeDate 
        FROM 
            dbo.Badges GROUP BY UserId
        ) i
    ON o.UserId = i.UserId

2019-04-18-07-26-36

(1318413 rows affected)
Table 'Workfile'. Scan count 0, logical reads 0, ...
Table 'Worktable'. Scan count 0, logical reads 0, ...
Table 'Badges'. Scan count 2, logical reads 43862, ...

(1 row affected)

 SQL Server Execution Times:
   CPU time = 2516 ms,  elapsed time = 5350 ms.

If we look at the IO statistics, it's interesting to note that there is no difference in reads between these two queries.

Looking at the CPU time statistics however, this derived table query consistently comes in about 33% faster than the correlated subquery example. Why is that?

Looking at the execution plan reveals some details: in this plan, you can see we read in from the dbo.Badges index and go straight into a Hash Match operator. The top stream is deduping our data on UserId, taking it from ~8 million rows to ~1 million rows. The bottom stream does the same deduping while also calculating the MIN(DATE) for each UserId grouping.

When both of those streams join together, the final hash match operator is only joining ~1 million rows with ~1 million rows (as opposed to the first query that was joining ~8 million rows with ~1 million rows).

This last join is the reason for the performance improvement: because this execution plan can reduce the number of rows sooner the final join ends up having to do less work. Additionally, the records were already distinct going into the join, saving us from an extra deduping step.

Further Reducing Redundancy

You may have noticed that both of these queries are a little redundant: they both call on the dbo.Badges table unnecessarily. The best option to improve query performance would be to rewrite it as:

SELECT 
    UserId, 
    MIN(Date) as FirstBadgeDate 
FROM 
    dbo.Badges 
GROUP BY 
    UserId

2019-04-18-07-48-58-1

While this is the most efficient query of the three, most real-world queries and scenarios aren't this easy to simplify.

When your queries have more joins, WHERE clauses, and more, knowing how to refactor from a correlated subquery to a derived table query is critical to potentially improving performance.

Optimizing for Ad Hoc Workloads

Watch this week's video on YouTube

The execution plan cache is a great feature: after SQL Server goes through the effort of generating a query plan, SQL Servers saves that plan in the plan cache to be reused again at a later date.

One downside to SQL Server caching almost all plans by default is that some of those plans won't ever get reused. Those single use plans will exist in the plan cache, inefficiently tying up a piece of the server's memory.

Today I want to look at a feature that will keep these one-time use plans out of the plan cache.

Plan Stubs

Instead of filling the execution plan cache with plans that will never get reused, the optimize for ad hoc workloads option will cache a plan stub instead of the full plan. The plan stub is significantly smaller in size and is only replaced with the full execution plan when SQL Server recognizes that the same query has executed multiple times.

This reduces the amount of size one-time queries take up in t he cache, allowing more reusable plans to remain in the cache for longer periods of time.

Enabling this server-level feature is as easy as (a database scoped versions :

sp_configure 'show advanced options',1
GO
reconfigure
GO  
sp_configure 'optimize for ad hoc workloads',1
GO
reconfigure
go

Once enabled you can watch the plan stub take up less space in the cache:

-- Run each of these queries once
DECLARE @Username varchar = 'A'
SELECT UserName 
FROM IndexDemos.dbo.[User] 
WHERE UserName like @Username+'%';
GO

DECLARE @Username varchar = 'B'
SELECT UserName 
FROM IndexDemos.dbo.[User] 
WHERE UserName like @Username+'%';
GO

SELECT 
    cp.cacheobjtype,
    cp.objtype,
    cp.plan_handle,
    cp.size_in_bytes,
    qp.query_plan,
    st.text
FROM
    sys.dm_exec_cached_plans cp
    CROSS APPLY sys.dm_exec_query_plan(cp.plan_handle) qp
    INNER JOIN sys.dm_exec_query_stats qs
        ON cp.plan_handle = qs.plan_handle
    CROSS APPLY sys.dm_exec_sql_text(qs.sql_handle) st
WHERE 
    st.text like 'DECLARE @Username varchar =%';

424 bytes each, these plan stubs are tiny!

Now if we run our second query filtering on UserName LIKE 'B%' again and then check the plan cache, we'll notice the stub is replaced with an actual compiled plan:

image-2

The downside to plan stubs is that they add some cpu load  to our server: each query gets compiled twice before it gets reused from cache.  However, since plan stubs reduce the size of our plan cache, this allows more reusable queries to be cached for longer periods of time.

Great! All my cache problems will be solved

Not necessarily.

If your workload truly involves lots of ad hoc queries (like many analysts all working on different problems or dynamic SQL that's generating completely different statements on every execution), enabling Optimize for Ad hoc Workloads may be your best option (Kimberly Tripp also has a great alternative: clearing single use plans automatically on a schedule).

However, often times single-use query plans have a more nefarious origin: unparameterized queries. In this case, enabling Optimize for Ad hoc Workloads may not negatively impact your server, but it certainly won't help. Why? Because those original queries will still be getting generated.

Brent Ozar has a good overview of why this happens, but the short answer is to force parameterization on your queries. When you enable force parameterization, SQL Server will ~~not~~ automatically parameterize your queries if they aren't already, reducing the number of one off query plans in your cache.

Whether you are dealing with too many single use queries on your server or some other problem, just remember to find the root cause of the problem instead of just treating the symptoms.

Visualizing Nested Loops Joins And Understanding Their Implications

This post is the first in a series about physical join operators (be sure to check out part 2 - merge joins, and part 3 - hash match joins).

Watch this week's video on YouTube

What Physical Join Operators Tell Us

Everyone has their own method of reading an execution plan when performance tuning a slow SQL query.  One of the first things I like to look at are what kind of join operators are being used:

image-1

These three little icons may not seem like the most obvious place to begin troubleshooting a slow query, but with larger plans especially I like starting with a quick glance at the join operators because they allow you to infer a lot about what SQL Server thinks about your data.

This will be a three part series where we'll learn how each join algorithm works and what they can reveal about our upstream execution plan operators.

Nested Loops Join

Nested-Loop-Join-50fps-1

Nested loops joins work like this: SQL Server takes the first value from our first table (our "outer" table - by default SQL Server decides for us which table of the two this will be), and compares it to every value in our second "inner" table to see if they match. 

Once every inner value has been checked, SQL Server moves to the next value in the outer table and the process repeats until every value from our outer table has been compared to every value in our inner table.

This description is a worst case example of the performance of a nested loop join.  Several optimizations exist that can make the join more efficient.  For example, if the inner table join values are sorted (because of an index you created or a spool that SQL Server created), SQL Server can process the rows much faster:

nest-loops-sorted-50fps-2

In the above animation, the inner input is a index sorted on the join key, allowing SQL Server to seek directly to the rows it needs, reducing the total number of comparisons that need to be made

For more in-depth explanations of the internals and optimizations of nested loops joins, I recommend reading this post by Craig Freedman as well as Hugo Kornelis's reference on nested loops.

What Do Nested Loops Joins Reveal?

Knowing the internals of how a nested loops join works allows us to infer what the optimizer thinks about our data and the join's upstream operators, helping us focus our performance tuning efforts. 

Here are a few scenarios to consider the next time you see a nested loops join being used in your execution plan:

  • Nested loops joins are CPU intensive; at worst, every row needs to be compared to every other row and this can take some time.  This means when you see a nested loops join, SQL Server probably thinks that one of the two inputs is relatively small.
  • ... and if one of the inputs is relatively small, great!  If instead you see upstream operators that are moving large amounts of data, you may have a estimation problem going on in this area of the plan and may need to update stats/add indexes/refactor the query to have SQL Server provide better estimates (and maybe a more appropriate join).

  • Nested loops sometimes accompany RID or key lookups.  I always check for one of these because they often leave room for some performance improvements:

    • If a RID lookup exists, it's usually easy enough to add a clustered index to that underlying table to squeeze out some extra performance.
  • If either RID or key lookup exist, I always check what columns are being returned to see if a smaller index could be used instead (by including a column in a key/column of an existing index) or if the query can be refactored to not bring back those columns (eg. get rid of the SELECT *).

  • Nested loops joins do not require data to be sorted on input.  However, performance can improve with an indexed inner data source (see animation above), and SQL Server might choose a more efficient operator if the inputs are both sorted. 

    • At the very least, nested loops joins make me think to check whether the input data isn't sorted because of some upstream transformations, or because of missing indexes.

So while nested loops in your plans will always require more investigation, looking at them and the operators around them can provide some good insight into what SQL Server thinks about your data.