Ignoring NULLs with FIRST_VALUE

Watch this week's video on YouTube

The SQL Server FIRST_VALUE function makes it easy to return the "first value in an ordered set of values."

The problem is that if that first value happens to be a NULL, there is no easy, built-in way to skip it.

While a UserVoice item exists to add the ability to ignore nulls (go vote!), today, we're going accomplish that end result with some alternative queries.

The Setup

Here's the example data we'll be skipping nulls on:

CREATE TABLE ##Data
(
       Id int IDENTITY(0,1),
       GroupId int,
       Value1 int
);
GO
INSERT INTO ##Data VALUES (1,1)
INSERT INTO ##Data VALUES (1,3)
INSERT INTO ##Data VALUES (2,NULL)
INSERT INTO ##Data VALUES (2,6)
INSERT INTO ##Data VALUES (2,4)
INSERT INTO ##Data VALUES (2,5);
GO

colall

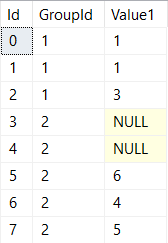
We've got a an integer identity column, two groups of rows, and NULLs that are sprinkled into otherwise unsuspecting integer values.

If we write a query that uses the FIRST_VALUE function, you'll notice that our NULL gets chosen in group two - not quite what we want:

SELECT
       Id,
       GroupId,
       Value1,
       FIRST_VALUE(Value1) OVER (PARTITION BY GroupId ORDER BY Id) AS FirstValue1
FROM
       ##Data

2018-08-26_08-38-39

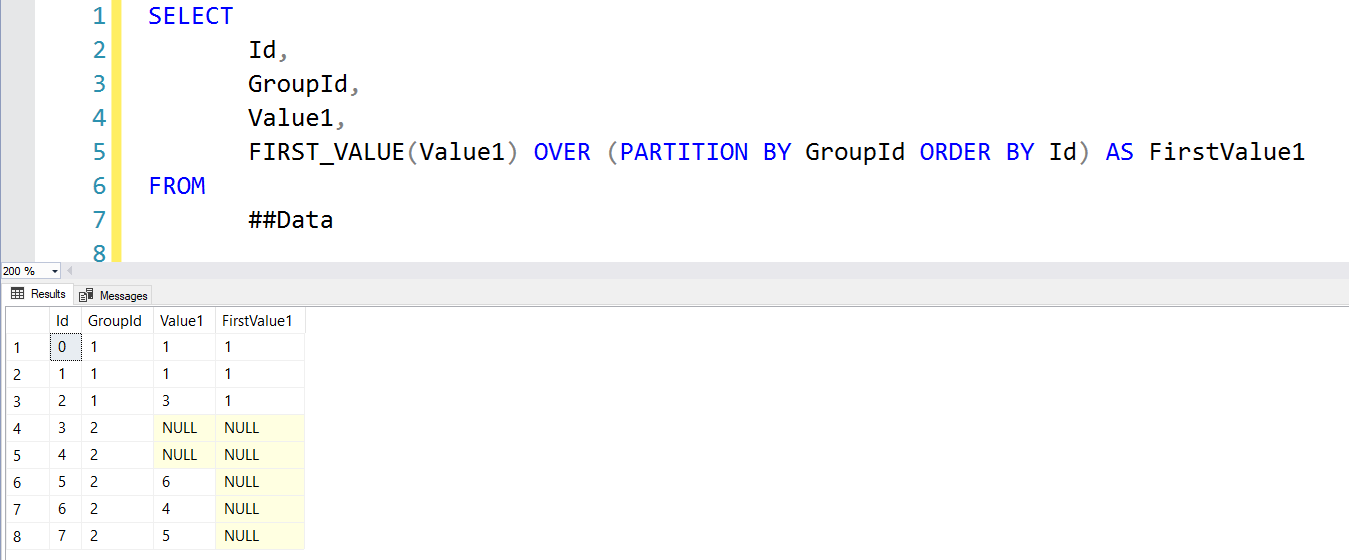
Let's look at two queries that will help us get the number 6 into that FirstValue1 column for the second group.

The Contenders

"The Derived FIRST_VALUE"

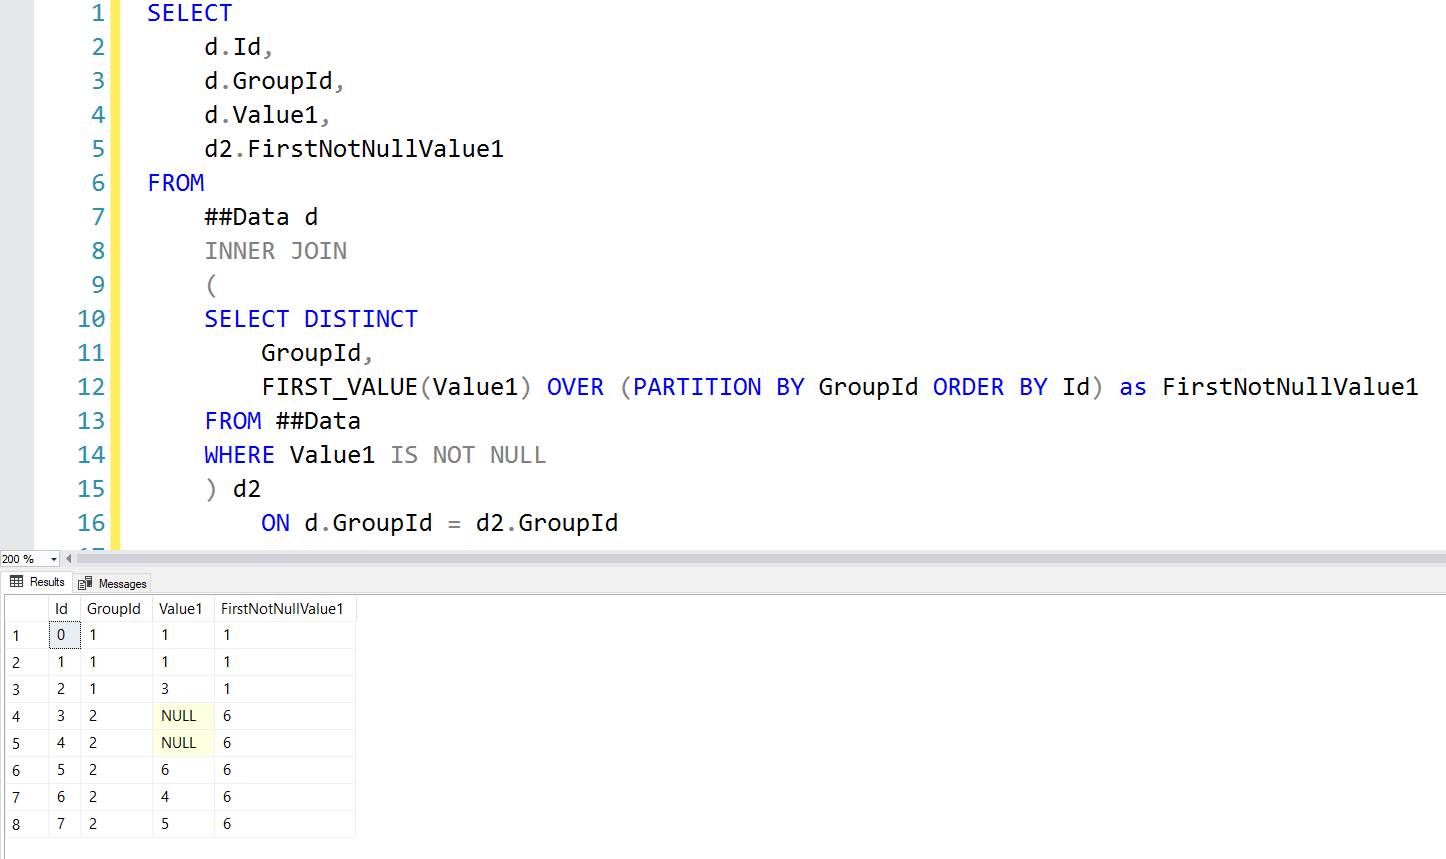
First up is still the FIRST_VALUE function, but inside of a derived table:

SELECT
    d.Id,
    d.GroupId,
    d.Value1,
    d2.FirstNotNullValue1
FROM
    ##Data d
    INNER JOIN
    (
    SELECT DISTINCT
        GroupId,
        FIRST_VALUE(Value1) OVER (PARTITION BY GroupId ORDER BY Id) as FirstNotNullValue1
    FROM ##Data
    WHERE Value1 IS NOT NULL
    ) d2
        ON d.GroupId = d2.GroupId

By filtering out NULLs in our derived table query, FIRST_VALUE returns the first non-null value like we want.  We then join that back to the original data and all is right again.
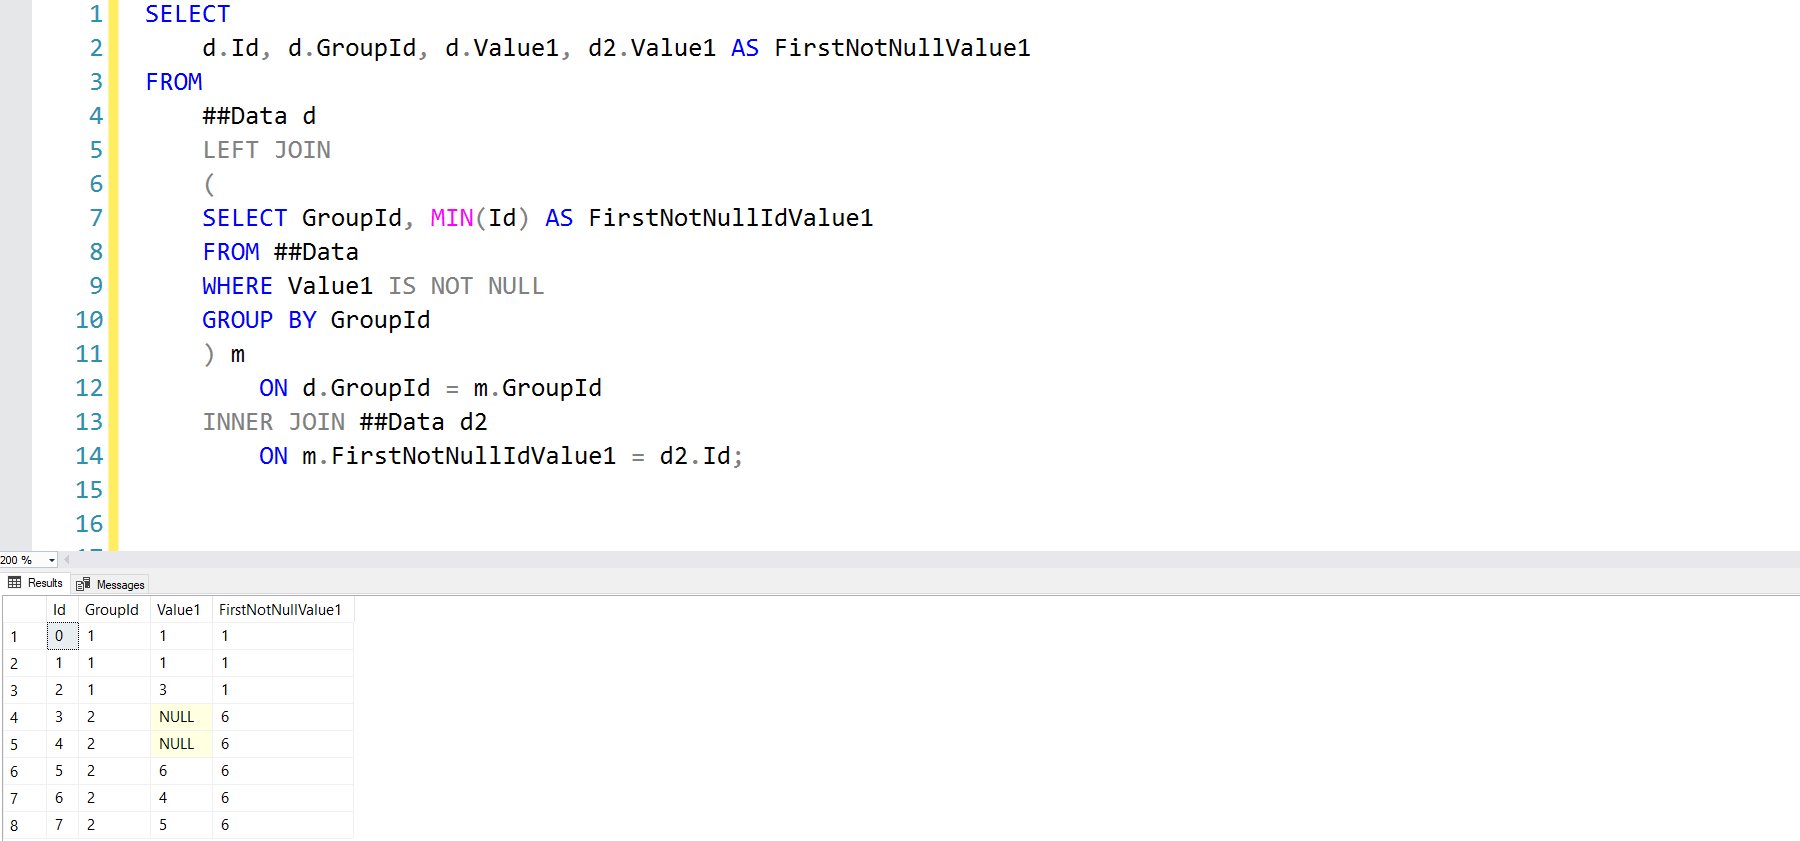
2018-08-26_08-42-00

"The Triple Join"

Our second attempt at this query sends us back to the dark ages of SQL Server 2008 before the FIRST_VALUE function existed:

SELECT
    d.Id,
    d.GroupId,
    d.Value1,
    d2.Value1 AS FirstNotNullValue1
FROM
    ##Data d
    LEFT JOIN
    (
    SELECT
        GroupId,
        MIN(Id) AS FirstNotNullIdValue1
    FROM
        ##Data
    WHERE
        Value1 IS NOT NULL
    GROUP BY
        GroupId
    ) m
        ON d.GroupId = m.GroupId
    INNER JOIN ##Data d2
        ON m.FirstNotNullIdValue1 = d2.Id;

We perform a triple join, with the critical element being our derived table which gets the MIN Id for each group of rows where Value1 IS NOT NULL.  Once we have the minimum Id for each group, we join back in the original data and produce the same final result:

2018-08-26_08-46-00

The Performance

Both of the above queries produce the same output - which one should you use in your production code?

Well, the "Derived FIRST_VALUE" query has a lower relative cost than the "Triple Join" query, maybe it's better?

2018-08-26_08-48-22

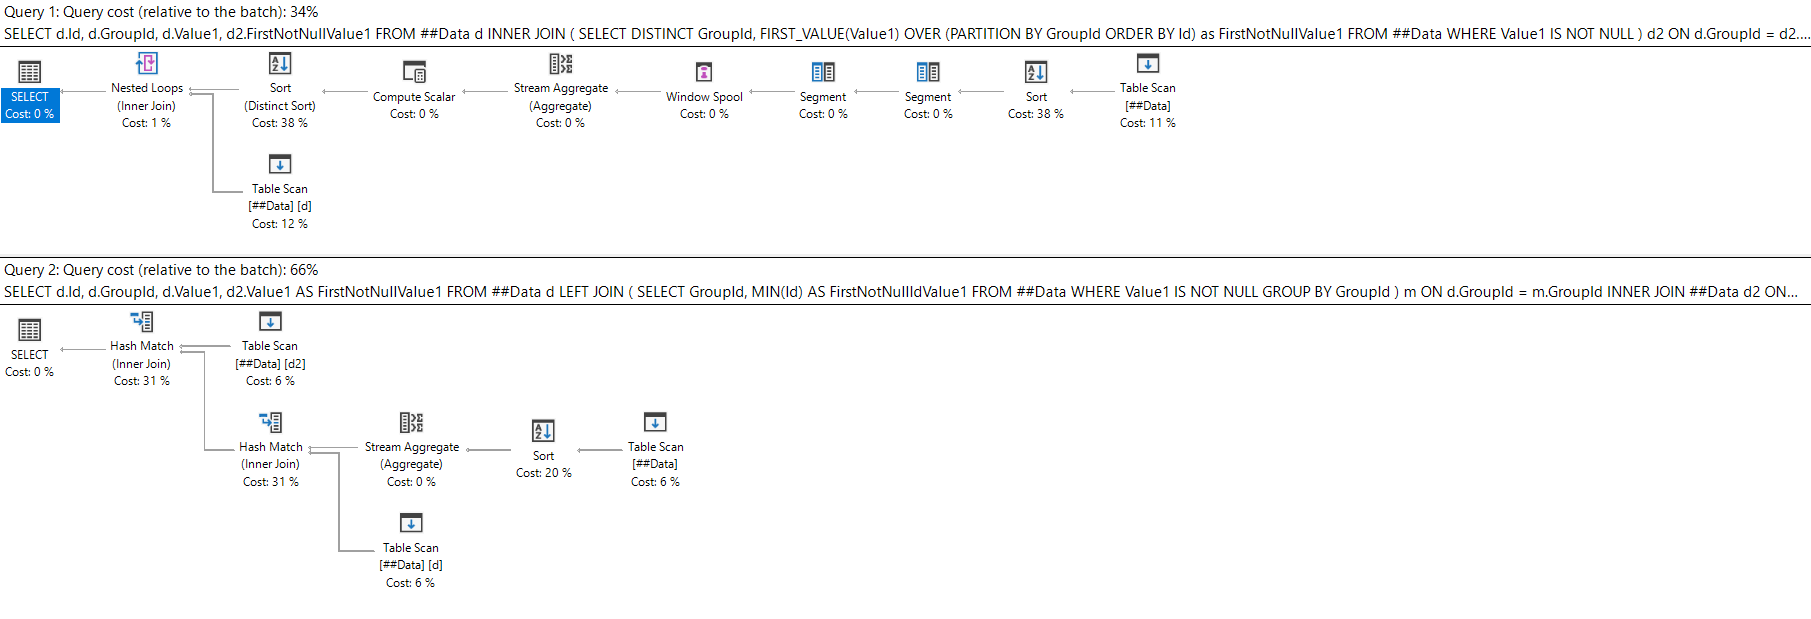
This isn't a real-world execution plan though - surely we never scan heaps our production environments.

Let's add a quick clustered index and see if that changes anything:

CREATE CLUSTERED INDEX CL_Id ON ##Data (GroupId,Id,Value1)

2018-08-26_09-07-57

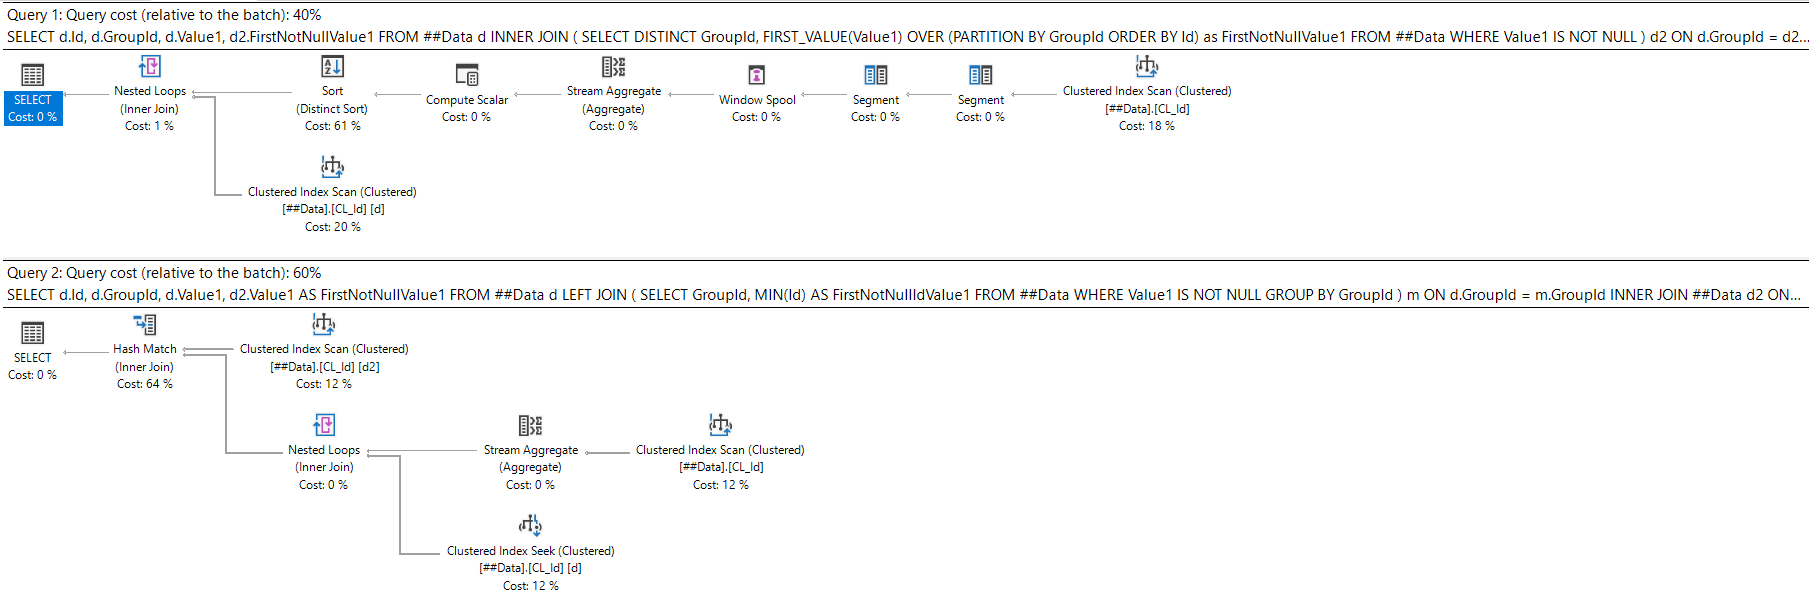
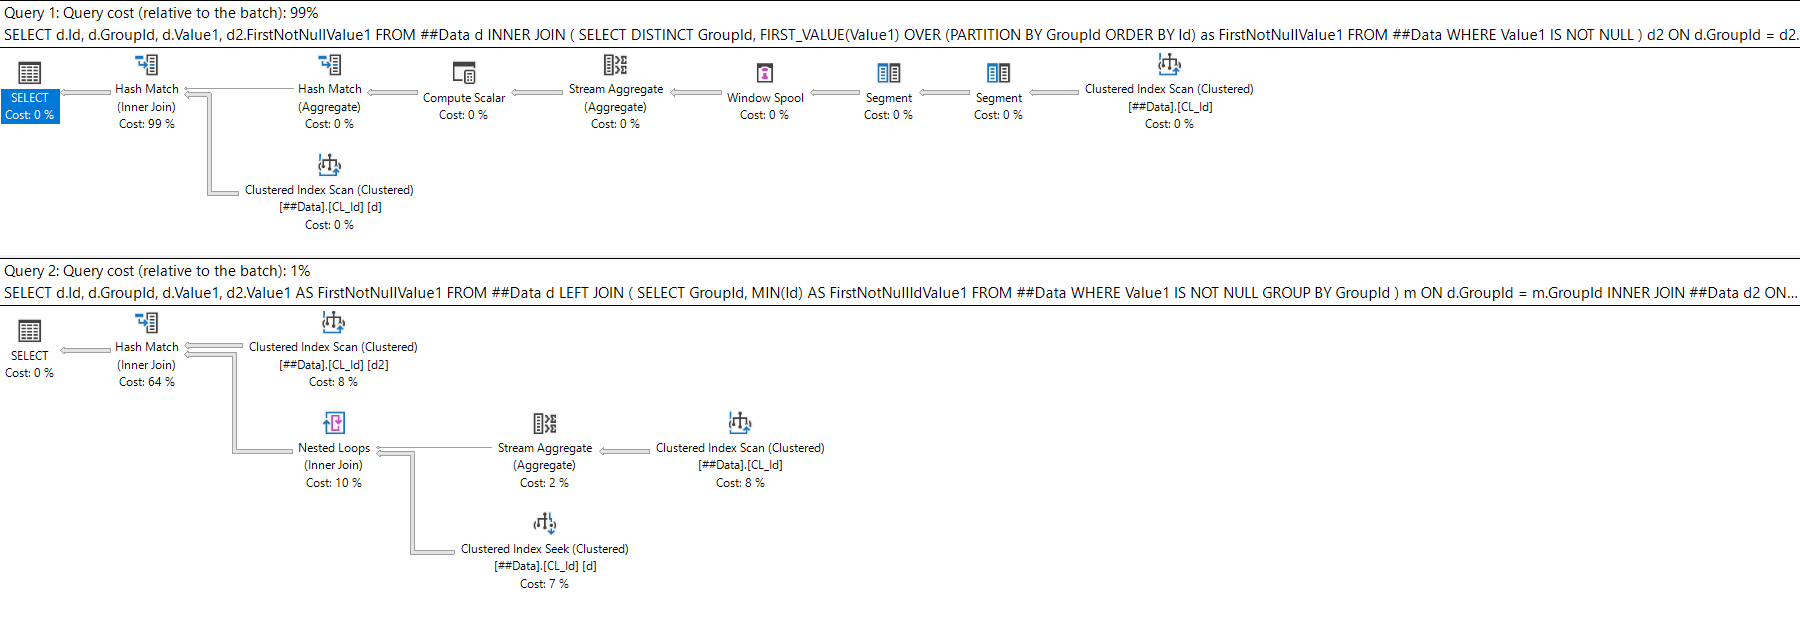
Okay, a closer match up but the "Derived FIRST_VALUE" query still appears to have a slight edge.

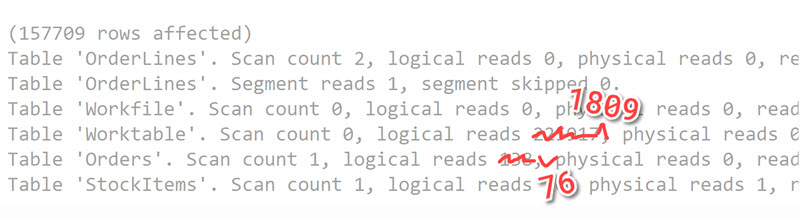
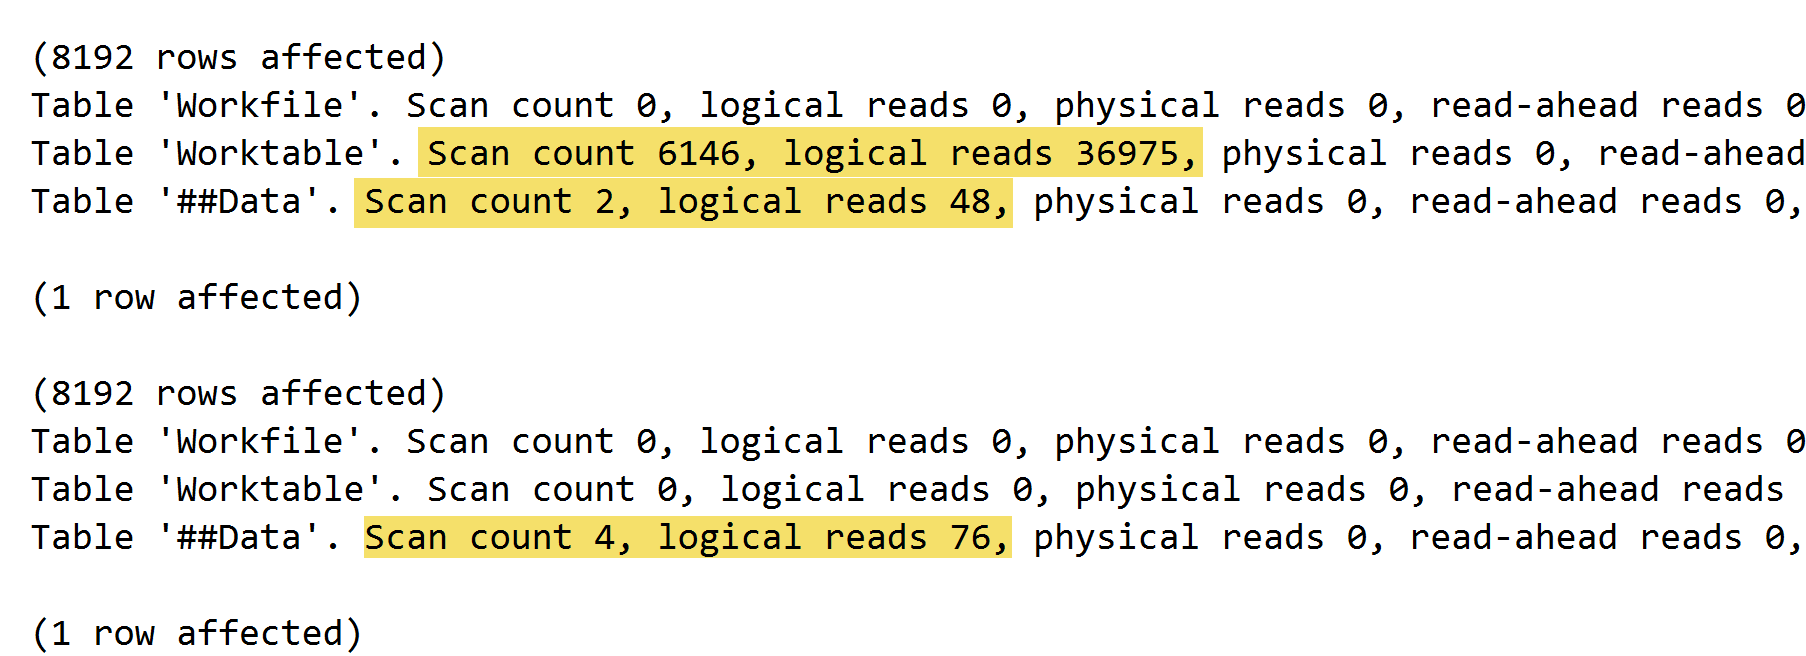
If we SET STATISTICS IO ON though we start to see a different story:

2018-08-26_09-14-05

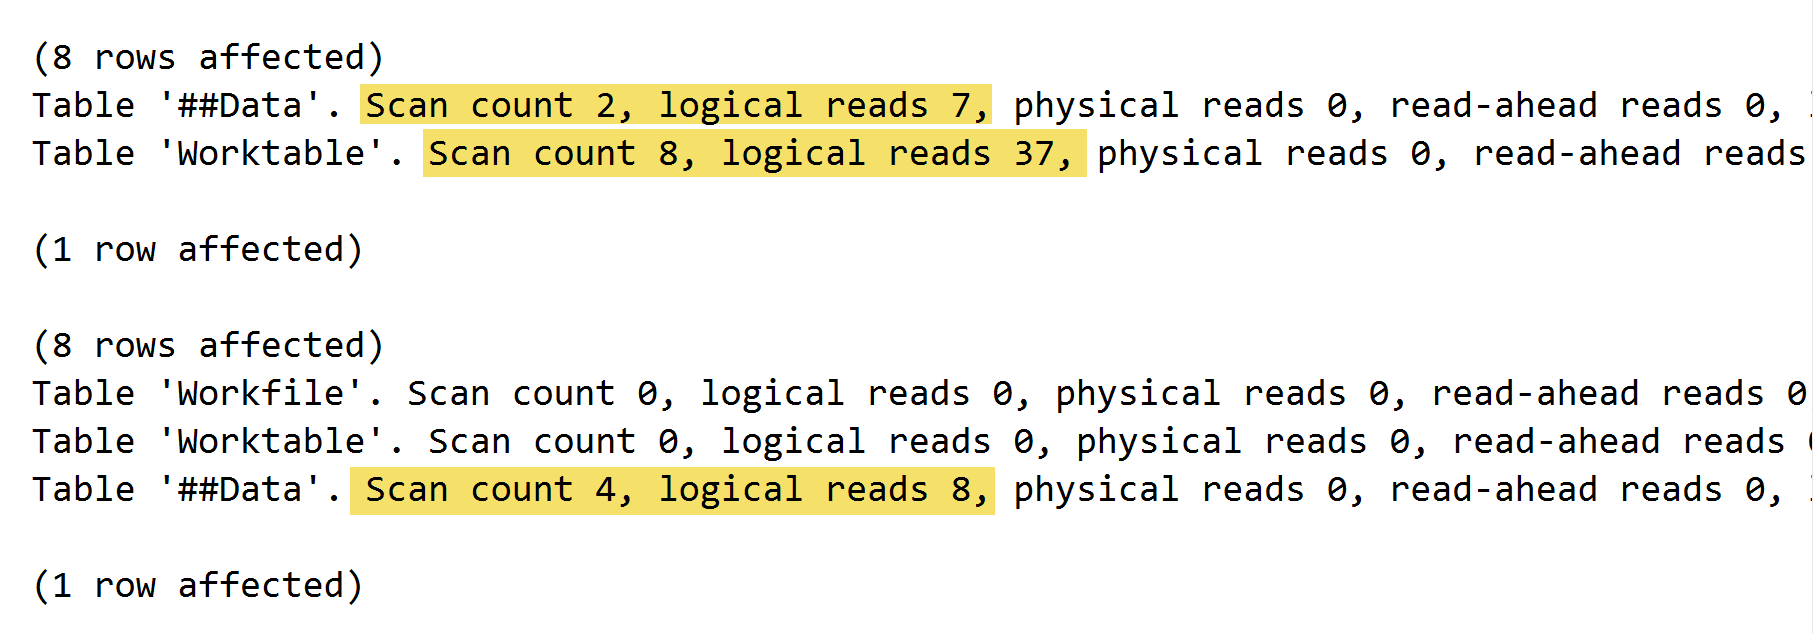
With only 8 rows of data, our "Derived FIRST_VALUE" query sure is performing a lot of reads.

What if we increase the size of our sample dataset?

SET STATISTICS IO, TIME OFF;
SET NOCOUNT ON;
GO
INSERT INTO ##Data (GroupId, Value1)  
SELECT GroupId, Value1 FROM ##Data
GO 10

And now check our plans and stats IO:

2018-08-26_09-17-33

2018-08-26_09-17-50

WOW that's a lot of reads in the "Derived FIRST_VALUE" query.

Conclusion

Besides sharing some solutions, the point I tried to make above is that DON'T TRUST CODE YOU FIND ON THE INTERNET (or in books, or copied from colleagues, etc...)

Both of the above queries will return the first value without NULLs.  But they probably won't perform exactly the same as they did on my examples above.

Copy the above code for sure - but test it out. See what works better on your specific server configuration, data size, and indexes.  Maybe both queries are terrible and you need a third, better way of doing it (if you write one, let me know!) - but please, please, please, always test your code.

Reducing the Number of Reads in Your Queries

jamie-street-361489

In last week's post, we went over how one of best ways to improve query performance was to reduce the number of reads that your query has to do.

Less reads typically means faster query performance - so how can you reduce the number of reads SQL Server is required to make?

Watch this week's video on YouTube

Write more selective queries

Writing more selective queries can be done in a  few different ways.

For starters, if you don't need every column of data, don't use SELECT *.  Depending on the size of your rows, providing only the columns you need might allow SQL Server to use an index  that is narrower and/or denser.  An index that is narrow (fewer columns) or dense (more records per page) allows SQL Server to return the same amount of data you need in fewer pages.

The same thing goes for being more selective in your ON and WHERE clauses.  If you specify no WHERE conditions, SQL Server will return every single page in your table.  If you can filter down the data to exactly what you need, SQL Server can return only the data you need. This reduces logical reads and improves speed.

-- Read 1,000,000 pages
SELECT * FROM Products

-- Read 10,000 pages by being more selective in your SELECT and WHERE
SELECT ProductName FROM Products WHERE CreateDate > '2015-01-01'

Finally, do you have large object (LOB) data (eg. varchar(max), image, etc..) on the tables in your query? Do you actually need it in your final result set? No?  Then don't include it as part of your reads!  This could mean creating an index on the columns you do need or putting your LOB data in a separate table and only joining to it when you need it.

-- Read 1,000,000 pages because your Products table has a LOB field and nothing besides a clustered index
SELECT ProductName FROM Products WHERE CreateDate > '2017-08-01'

-- Read in 1000 pages only because you put your lob column on a separate table.
-- Or you created an index that contains ProductName and not your LOB column.
-- Same query, better performance!
SELECT ProductName FROM Products WHERE CreateDate > '2017-08-01'

-- Need that LOB data?  Just join in the separate table.  Reads are large here, but at least you only are reading when you truly need that LOB data.
SELECT 
  p.ProductName, 
  pe.ProductExtendedProperties -- this is nvarchar(max)
FROM
  Products p
  INNER JOIN ProductLOBs pe
    ON p.ProductId = pe.ProductId

Fix suboptimal execution plans

It's possible that your query is already as selective as it can be.  Maybe you are getting too many reads because SQL Server is generating and using a suboptimal execution plan.

A big tip off that this might be happening is if your cardinality estimates are out of whack a.k.a. the estimated vs. actual row counts have a large difference between them:

2017-12-06_12-36-57

If SQL Server thinks it only is going to read 1 row of data, but instead needs to read way more rows of data, it might choose a poor execution plan which results in more reads.

You might get a suboptimal execution plan like above for a variety of reasons, but here are the most common ones I see:

If you had a query that previously ran fine but doesn't anymore, you might be able to utilize Query Store to help identify why SQL Server started generating suboptimal plans.

The key is to get a good execution plan so that you aren't performing unnecessary reads.

But what if you aren't encountering any of the problems above and performance is still slow due to high numbers of reads?  Simply...

Add an index

mike-marquez-342243 A cup of coffee and a shot of espresso might have the same caffeine content - espresso is just more caffeine dense, just like the data stored in a narrow index.  Photo by Mike Marquez on Unsplash

If you have an existing table that has many columns and you only need a subset of them for your query, then consider adding an index for those columns.

Indexes are copies of your data stored in a different order with generally fewer columns.  If SQL Server is able to get all of the information it needs from a narrow index, it will do that instead of reading the full table/clustered index.

A copy of the data that has fewer columns will have greater page density (or the amount of data that fits on each page).  If SQL Server can get all of the data it needs by reading fewer, denser pages then your query will run faster.

Don't just go adding indexes willy nilly though.  You may already have an index that almost contains all of the columns your query needs.  Look at a table's existing indexes first and see if any of them are close to what you need.  Usually, you'll be better off adding an included column or two to an existing index instead creating a whole brand new index.  And you'll save on disk space by not creating duplicate indexes either.

Reduce index fragmentation

So indexes are great for reducing reads because they allow us to store only the data that is needed for a specific query (both as key columns and included columns).  Fewer columns = greater density = fewer reads necessary.

However, indexes can become  fragmented.  There's internal fragmentation, which causes less data to be stored on a page than what is possible, and external fragmentation which causes the pages to be stored out of logical order on the disk.

Internal fragmentation is problematic because it reduces page density, causing SQL Server to have to read more pages in order to get all of the data it needs.

External fragmentation is problematic, especially for spinning disk hard drives, because SQL Server needs to read from all over the disk to get the data it needs.

In general, reorganizing or rebuilding an index are the typical ways you want to fix a fragmented index.

To slow down future fragmentation, you can test out different fill factors to try and prevent page splits from fragmenting your indexes.

How to use Statistics IO to Improve Your Query Performance

2017-12-01_12-45-05

SQL Server's STATISTICS IO reporting is a great tool to help you performance tune queries.

Usually the goal of performance tuning is to make your query run faster.  One of the easiest ways to get a faster query is to reduce the amount of data a query is processing.  STATISTICS IO makes it easy to see how much data SQL Server is actually processing.

Specifically, the STATISTICS IO output helps with performance tuning because:

  1. The data it shows acts as a measuring stick for your performance tuning changes.
  2. It provides a good way of isolating the query changes you are making from other changes that may be happening on the server.

Watch this week's video on YouTube

So what's STATISTICS IO data look like?

To show IO statistics on your query, you first need to execute:

-- This applies to your current session only
SET STATISTICS IO ON;
GO

After running a query with with the above setting turned on, check SQL Server Management Studio's Messages tab to see output that looks something like this:

(157709 rows affected)
Table 'OrderLines'. Scan count 2, logical reads 0, physical reads 0, read-ahead reads 0, lob logical reads 159, lob physical reads 0, lob read-ahead reads 0.
Table 'OrderLines'. Segment reads 1, segment skipped 0.
Table 'Workfile'. Scan count 0, logical reads 0, physical reads 0, read-ahead reads 0, lob logical reads 0, lob physical reads 0, lob read-ahead reads 0.
Table 'Worktable'. Scan count 0, logical reads 225917, physical reads 0, read-ahead reads 0, lob logical reads 225702, lob physical reads 0, lob read-ahead reads 0.
Table 'Orders'. Scan count 1, logical reads 138, physical reads 0, read-ahead reads 0, lob logical reads 0, lob physical reads 0, lob read-ahead reads 0.
Table 'StockItems'. Scan count 1, logical reads 16, physical reads 0, read-ahead reads 0, lob logical reads 0, lob physical reads 0, lob read-ahead reads 0.

The key things that my eyes are drawn to on initial examination of the STATISTICS IO output are the following:

  • Logical reads: The number of 8kB pages SQL Server had to read from the buffer cache (memory) in order to process and return the results of your query.  The more pages that need to be read, the slower your query.
  • Worktables/Workfiles: These are temporary objects that SQL Server creates in tempdb in order to process query results.  Although not always bad, it might indicate that SQL is doing more work than it needs to (perhaps an index could help?)
  • Lob Logical Reads: The number of large objects (e.g. varchar(max)) SQL is having to read.  I take the most cursory glance at this - if I'm returning high numbers of lobs, I might want to make sure I actually need them.  If not, I may add an index or move the lobs off to a separate table.

There are more properties in the STATISTICS IO output, but if we can significantly decrease the above three indicators then chances are good that we'll improve our query performance.

So why are these three indicators so useful?

Tracking performance changes

The main reason I like performance tuning with STATISTICS IO is because it makes it easy to create a baseline for my query performance.  When I make changes to the query, it's then easy to see if my changes helped or hurt the query.

The main metric I use for this is logical reads.  Logical reads refers to pages pulled from the cache (memory) versus physical reads which indicates the number of pages from disk.  However, all pages get loaded from disk into cache before SQL Server is able to use them.

This makes logical reads great for tracking performance changes because it clearly tells me how many 8kB pages in total SQL Server needed to read in order to my return my data.

If I add an index, does the total number of pages read go up or down?  Let me check my logical read counts and see.

What if I add some additional filtering or restructure my query?  I can easily tell if my changes hurt performance by seeing if the total number of logical reads went up or down.

Logical reads allow me to easily track the effectiveness of my tuning tactics.

The same concept applies to my worktable and logical lob read properties.  For the former, any time SQL Server is having to write data out to disk (tempdb in this case), performance will be slower.

In the latter case, if SQL Server is needing to move around large objects that comprise of multiple 8kB pages each, things will be slow.  If I can keep track of how many lob logical reads SQL Server is performing, then I can focus on removing that overhead from my query.

Isolating other factors that impact performance

For the same reason logical reads make it easy to track query performance after making changes, using logical reads makes it easy to mute other factors that might affect performance.

For example, I used to think that simply watching how long it took a query to run was a good indicator of helping me performance tune.  If the total number of seconds it took my query to run decreased, my changes helped improve performance!

This is a potentially deceptive way to measure performance though because what if during my first run the server was getting slammed by other queries?  Using elapsed run time isn't an effective way to measure performance.

Also, server environment hardware isn't always the same.  I might test a query in one environment and then deploy it to another.  My testing on an empty dev box might have been great, but as soon as the query runs in production along with all other queries, it might not perform as well.

More than one way to analyze a query

STATISTICS IO is a great place to start your performance tuning process.

It doesn't mean that you have to stop there though.  While being able to track the effects of your tuning changes and isolating other environment variables is important, ultimately you will have to use other means to actually improve performance.

So be sure to look at execution plans, dig into index and table statistics, rewrite the order of your table joins to see if it makes a difference, etc...  Just remember, performance always comes back to how much data SQL Server needs to process - reduce that and your queries will surely perform better.