Watch this week's video on YouTube
SQL Server needs to make sure data types match when performing operations that involve multiple pieces of data.
When the data types do not match, SQL Server has to implicitly convert the data before performing any operations.
While most of the time these implicit conversions go unnoticed, they are important to understand since they can lead to unexpected results.
When 4.4/.44 Doesn't Equal 10
Let's start with this example:
SELECT 4.4/CAST(.44 AS VARCHAR(5))
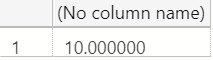
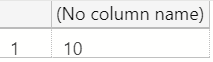
Ignoring for a moment that our denominator is of type VARCHAR, if we do some quick mental math or use a calculator, we can see that the answer should be 10:
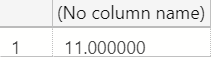
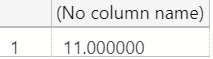
However, if we look at the result SQL Server returns, it's strangely 11:
To understand why this happens, we need to understand SQL Server's data type precedence logic.
Data Type Precedence
If we start with a simpler version of this example, we'll see SQL Server does in fact know how to perform math and return an answer of 10:
SELECT 4.4/.44
We can use the SQL_VARIANT_PROPERTY() function to see what data types SQL Server is assuming we are using in our calculation:
SELECT
    SQL_VARIANT_PROPERTY(4.4,'BaseType'),
    SQL_VARIANT_PROPERTY(.44,'BaseType'),
    SQL_VARIANT_PROPERTY(4.4/.44,'BaseType')
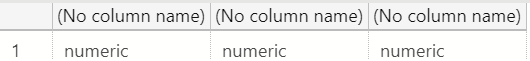
In this case, since the data types of both components are numeric, SQL Server doesn't have to break a sweat making any drastic conversions to give us our expected answer. If we instead give it something a little more challenging:
SELECT 4.4/CAST(.44 AS FLOAT)
Here we still return the result of 10, however SQL Server had to do a little more work. We know from the previous example that 4.4 on its own is of type numeric, and in this example we are explicitly casting .44 to a float. SQL Server isn't able to perform the division operation directly on two different data types, so it refers to its data type precedence table to decide which value to convert to a matching datatype.
In the linked table above, the float data type appears higher on the list than numeric (synonym: decimal) data type. This causes SQL Server to convert our numeric 4.4 to a float before dividing.
While SQL Server is doing extra work behind the scenes that we didn't explicitly request, we can't be too angry with it since it still is giving us the "correct" answer.
"Incorrect" Conversions
Let's look at something a little more dastardly:
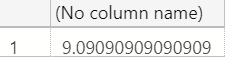
SELECT CAST(4.4 AS NUMERIC)/CAST(.44 AS FLOAT)
You might think this should also return 10 based on the previous example, but in fact it returns 9.090909:
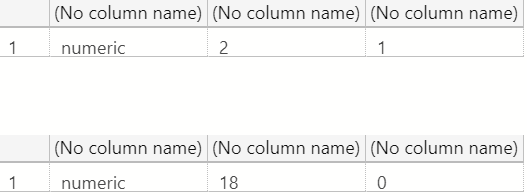
While we are still witnessing implicit conversion here (the numeric gets converted to a float in order to allow SQL Server to perform the division), we are also experiencing a case of default data type precision and scale. If we use the SQL_VARIANT_PROPERTY() function again to not only reveal base type but also precision and scale, we'll notice that when we let SQL Server "guess" the scale, it correctly chooses 1 decimal place, while when we use the default scale associated with numeric we get 0:
SELECT
    SQL_VARIANT_PROPERTY(4.4,'BaseType'),
    SQL_VARIANT_PROPERTY(4.4,'Precision'),
    SQL_VARIANT_PROPERTY(4.4,'Scale')

SELECT
    SQL_VARIANT_PROPERTY(CAST(4.4 AS NUMERIC),'BaseType'),
    SQL_VARIANT_PROPERTY(CAST(4.4 AS NUMERIC),'Precision'),
    SQL_VARIANT_PROPERTY(CAST(4.4 AS NUMERIC),'Scale')
What this really means is that the decimal portion of 4.4 is getting chopped off, leaving us with an equation of 4 / .44 = 11.
Putting Everything Together
So back to our original example that returns 11:
SELECT 4.4/CAST(.44 AS VARCHAR(5))
What exactly is going on here? Well for starters, data type precedence is forcing SQL Server to convert the VARCHAR .44 to a numeric. But a numeric with what precision and scale?
SELECT
    SQL_VARIANT_PROPERTY(4.4,'BaseType'),
    SQL_VARIANT_PROPERTY(4.4,'Precision'),
    SQL_VARIANT_PROPERTY(4.4,'Scale')
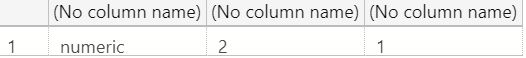
Since SQL Server determines that our numerator is NUMERIC(2,1), it converts the denominator to a NUMERIC(2,1) as well. This means instead of dividing by .44, we end up dividing by .4 which results in 11:
-- An explicit version of the same calculation
SELECT CAST(4.4 AS NUMERIC(2,1))/CAST(.44 AS NUMERIC(2,1))
SQL Server Isn't Wrong
While it's easy to blame SQL Server for not knowing how to perform simple mathematical operations, it's us the developers who are to blame. SQL Server is a piece of software following rules for how to handle unclear situations that we input into it.
Having SQL Server throw an error instead of assuming data types and implicitly converting data on our behalf would make things less ambiguous, but it would also make simple operations a lot more tedious (looking at you SSIS).
In reality, the best solution is to accurately define data types from initial creation and to always be explicit with data types when the value of your computations matters.